
SLS-214 · Lesson 8 of 12 · 21 min
Forecast categories and judgment
▶ Video coming soon A video version of this lesson is on the way.
On Tuesday, November 10, Prairie Valley's evaluation committee selected Ridgeline for the school division's managed print contract, subject to board approval on November 17 and a signed agreement. At the Friday session three days later, the last before the fiscal year ended, Grace said that this one email had changed the forecast more than any formula could. "The weighted pipeline gave Prairie Valley 75 in 100 because it was in Negotiate. Darnell now thinks it's closer to 90. The CRM doesn't know what Darnell knows. A good forecast uses both."
Lesson 7 built a mechanical forecast from stage probabilities. This lesson covers the method most sales teams actually use to report forecasts: forecast categories, in which sellers and managers sort each deal by how confident they are that it will close in the period, and then combine those calls into a forecast that is checked against the mechanical one. It ends with how to measure whether forecasts are any good.
Forecast categories
Most CRMs and sales teams use a small set of categories. Ridgeline used four, plus closed deals.
| Category | Meaning | Rule of thumb at Ridgeline |
|---|---|---|
| Closed | Signed and booked in the period | Counted in full |
| Commit | The seller would stake their reputation on it closing this period | Historically about 90 in 100 of commit value closes |
| Best case | Could close this period if things go well | Historically about 40 in 100 closes |
| Pipeline | Real opportunity, but not likely this period | Not counted in this period's forecast |
| Omitted | Not expected to close; kept open for tracking | Not counted |
Categories differ from stages. A stage describes where a deal is in the sales process, using exit criteria. A category describes the seller's judgment about timing. A deal can be in Negotiate but only best case for the quarter, because the customer's board does not meet until December. A deal in Propose can be commit, because the customer has said yes and is waiting only for a signature from an owner who is away.
The categories produce a range rather than a single number. The commit forecast is closed plus commit: what the team is confident of. The best-case forecast is closed plus commit plus best case: what is possible if things go well. The truth usually falls in between.
Rolling up the forecast
Each seller categorizes their own deals. Their manager reviews the calls deal by deal and may change them, and the manager's forecast rolls up to the next level. This roll-up happens every week in the last month of a quarter at Ridgeline, in a forecast call where each seller walks through their commit and best-case deals and answers questions.
Worked problem
Maya's categories
On November 13 Maya has 48,172 dollars of first-year value closed against her 75,000-dollar ramp quota. She puts her 13,200-dollar Prairie Valley assist in commit. Halverson Law has asked about adding a printer for its second floor, worth 2,268 dollars of first-year value, with a decision expected on November 27; she puts it in best case. None of her other deals is expected before December. Calculate her commit and best-case forecasts and the attainment each implies.
Show solution
- Commit forecast: closed plus commit.
- \[48{,}172 + 13{,}200 = 61{,}372\]
- \[\frac{61{,}372}{75{,}000} \approx 0.818\]
- Best-case forecast: add best case.
- \[61{,}372 + 2{,}268 = 63{,}640\]
- \[\frac{63{,}640}{75{,}000} \approx 0.849\]
Answer: Maya's commit forecast is 61,372 dollars, about 81.8 in 100 of her ramp quota, and her best case is 63,640 dollars, about 84.9 in 100. Her other deals, though healthy, belong to the next quarter.
Darnell asked Maya one question about her commit: "What has to happen for Prairie Valley to sign by November 30, and who controls each step?" Maya listed the board meeting on November 17, the lawyers' redline on liability and price increases, and the signatures. Darnell was satisfied it was a fair commit, with the risk sitting in the contract terms. This is the heart of forecast judgment: not a feeling, but a list of steps, dates and owners.
The team forecast
Worked problem
Commit, best case and an expected figure
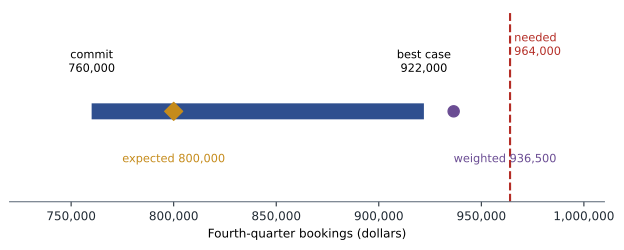
For the five established account executives and the Prairie Valley house account, the team has 512,000 dollars closed in the quarter. Sellers and managers put 248,000 dollars of first-year value in commit, including Prairie Valley's 66,000, and 162,000 dollars in best case. Calculate the commit and best-case forecasts for the quarter, and an expected figure using Ridgeline's historical rates of 90 in 100 for commit and 40 in 100 for best case. Then add the 2,036,000 dollars booked in the first three quarters.
Show solution
- Commit forecast.
- \[512{,}000 + 248{,}000 = 760{,}000\]
- Best-case forecast.
- \[760{,}000 + 162{,}000 = 922{,}000\]
- Expected figure.
- \[512{,}000 + 0.90 \times 248{,}000 + 0.40 \times 162{,}000 = 512{,}000 + 223{,}200 + 64{,}800 = 800{,}000\]
- Fiscal year totals.
- \[2{,}036{,}000 + 760{,}000 = 2{,}796{,}000\]
- \[2{,}036{,}000 + 800{,}000 = 2{,}836{,}000\]
- \[2{,}036{,}000 + 922{,}000 = 2{,}958{,}000\]
Answer: The quarter's forecast runs from 760,000 dollars (commit) to 922,000 (best case), with an expected figure of 800,000. For the year that is 2,796,000 to 2,958,000 dollars, with about 2,836,000 expected, roughly 94.5 in 100 of the 3,000,000-dollar quota.
Comparing the two forecasts
The weighted pipeline in lesson 7 gave 936,500 dollars for the quarter. The judgment-based expected figure was 800,000. Grace treated the gap of 136,500 dollars as the most useful number of the day, because it showed where the CRM and the sellers disagreed. She found three main sources.
| Source of the gap | Weighted pipeline | Sellers' judgment |
|---|---|---|
| Discover and Qualify deals dated November 30 | Counted at 25 and 10 in 100 | Almost all put in pipeline: too early to close this quarter |
| Deals that had slipped once already | Counted at full stage probability | Several moved to best case or pipeline |
| Two Negotiate deals waiting on customers' January budgets | Counted at 75 in 100 | Moved to the next quarter |
In this case judgment was more pessimistic than the formula, because the sellers knew about timing that the CRM did not. That is not always so. Sellers are often optimistic about their own deals, especially early in a quarter, and the weighted pipeline is a useful check on them. The point of comparing the two is that every large difference has to be explained.
Sandbagging and happy ears
Judgment has two well-known failure modes. Happy ears is hearing what you want to hear: a seller treats a customer's polite interest as a commitment and puts the deal in commit. Sandbagging is the opposite: a seller deliberately under-forecasts, so that results look good against expectations, or to hold deals back for a better commission period. Both make forecasts less useful.
Managers counter both with questions and with history. Grace kept a record of each seller's commit accuracy: how much of what they committed actually closed. A seller whose commits close 98 in 100 of the time may be sandbagging; one whose commits close 70 in 100 has happy ears. Darnell used the record to adjust each seller's calls in the roll-up, and to coach them.
Measuring forecast accuracy
A forecast can only improve if its errors are measured. The simplest measure is the forecast error for one period: the difference between forecast and actual, divided by actual.
A positive error means the forecast was too high; a negative one, too low. Over several periods, two summaries are useful. The mean absolute percentage error, or MAPE, averages the size of the errors, ignoring their sign, and shows how far off forecasts usually are. The bias averages the errors with their signs, and shows whether forecasts lean consistently high or low.
Worked problem
Ridgeline's forecast record
Ridgeline's leadership forecasts, made two weeks before quarter end, and actual bookings for its last four quarters were: fourth quarter of fiscal 2025, forecast 820,000 and actual 772,000; first quarter of 2026, 640,000 and 701,000; second quarter, 790,000 and 744,000; third quarter, 705,000 and 591,000. Calculate each forecast error, the MAPE and the bias.
Show solution
- Errors.
- \[\frac{820 - 772}{772} = +0.0622\]
- \[\frac{640 - 701}{701} = -0.0870\]
- \[\frac{790 - 744}{744} = +0.0618\]
- \[\frac{705 - 591}{591} = +0.1929\]
- MAPE: average the errors without their signs.
- \[\frac{0.0622 + 0.0870 + 0.0618 + 0.1929}{4} \approx 0.101\]
- Bias: average the errors with their signs.
- \[\frac{0.0622 - 0.0870 + 0.0618 + 0.1929}{4} \approx +0.057\]
Answer: The MAPE is about 10.1 in 100: forecasts were usually about a tenth off. The bias is about +5.7 in 100: forecasts leaned high, mostly because the third quarter was over-forecast by about 19.3 in 100.
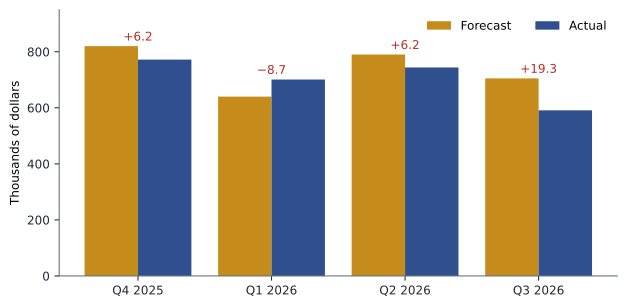
The third-quarter miss mattered most. It was a forecast made two weeks from the end of the quarter that was still almost a fifth too high. Grace traced it to the slipped close dates described in lesson 7 and to several school deals that had been in commit before school offices closed for the summer. Her recommendation for the fourth quarter was the method in this lesson: categories with written reasons, a check against the weighted pipeline, and large deals shown separately.
Reporting a forecast
Rob's report to Ridgeline's owners followed the format Grace recommended: a range and a most likely figure, the assumptions behind them, and the biggest single risk.
| Item | Fourth-quarter forecast as reported |
|---|---|
| Commit | 760,000 dollars |
| Most likely | About 800,000 dollars |
| Best case | 922,000 dollars |
| Fiscal year, most likely | About 2,836,000 dollars, roughly 94.5 in 100 of quota |
| Largest single risk | Prairie Valley contract terms (66,000 dollars first-year value) |
| Method check | Weighted pipeline 936,500; gap explained by early-stage and slipped deals |
The owners did not like hearing that the year would probably finish below quota, but Rob noted afterwards that they trusted the forecast more than any he had given before, because it came with its reasons. Whether it was right would be known on November 30, which the course leaves as a plan.
Forecast discipline in the last weeks
The forecast call in the last weeks of a quarter follows a routine at most companies, and Ridgeline's was typical. Each seller updates the CRM by Thursday evening. On Friday morning Darnell reviews every commit and best-case deal above 5,000 dollars of first-year value, asking the same three questions each time: what is the next step, who controls it, and what date will it happen. Any deal whose answer has not changed since the previous week is challenged, because a deal that is not moving is not getting closer to closing.
Grace also tracked how the commit number changed from week to week. A commit that rises steadily as deals are confirmed is healthy. A commit that falls late in the quarter, as deals slip out, is a warning about the next quarter too, because the slipped deals land there with less time to prepare. In the third quarter, the team's commit had fallen in each of the last four weeks, a pattern that should have prompted questions earlier than it did.
Grace's last point was about honesty. A forecast is a statement of what the team expects, not a target or a promise. Sellers sometimes feel pressure to forecast high to show confidence, or low to protect themselves. Ridgeline's leadership tried to remove that pressure by praising accurate forecasts, including accurate bad news, and by never using a seller's forecast against them in a performance review. A forecast that people are afraid to make honestly cannot be accurate.
Common mistakes
MistakeTreating forecast categories as the same thing as stages.
InsteadStages describe the process; categories describe the judgment about timing.
MistakeReporting a single number.
InsteadReport a range, a most likely figure and the main risk.
MistakeAccepting a commit without asking what must happen and who controls it.
InsteadList the steps, dates and owners behind every commit deal.
MistakeIgnoring a gap between the weighted and judgment forecasts.
InsteadExplain every large difference deal by deal.
MistakeNever checking forecasts against results.
InsteadTrack forecast error, MAPE and bias, and each seller's commit accuracy.
Summary and key terms
- Forecast categories sort deals by judgment about timing: closed, commit, best case, pipeline and omitted.
- The commit forecast is closed plus commit; the best case adds best-case deals.
- Maya's commit forecast was 61,372 dollars and her best case 63,640.
- The team's fourth quarter ranged from 760,000 to 922,000 dollars, with about 800,000 expected using historical close rates of 90 in 100 for commit and 40 for best case, against a weighted forecast of 936,500.
- Every gap between the two should be explained.
- Judgment can fail through happy ears or sandbagging.
- Forecast error is forecast minus actual, divided by actual; MAPE averages its size and bias its sign.
- Ridgeline's MAPE was about 10.1 in 100 and its bias about +5.7.
- Forecast category
- A seller's judgment of how likely a deal is to close in the period, such as commit or best case.
- Commit
- A deal the seller is confident will close in the period.
- Best case
- A deal that could close in the period if things go well.
- Roll-up
- Combining sellers' forecasts into a manager's and then a company forecast.
- MAPE
- Mean absolute percentage error: the average size of forecast errors, ignoring sign.
- Bias
- The average forecast error with its sign, showing whether forecasts lean high or low.
- Sandbagging
- Deliberately forecasting low so results look good against expectations.
Practice problems
Work each problem on paper first, then reveal the answer to check.
A seller has 30,000 dollars closed, 20,000 in commit and 15,000 in best case. What are the commit and best-case forecasts?
Show answer
Commit: 50,000 dollars. Best case: 65,000 dollars.
A forecast of 550,000 dollars was followed by actual bookings of 500,000. What was the forecast error?
Show answer
(550,000 − 500,000) ÷ 500,000 = +0.10, or 10 in 100 too high.
Errors over three quarters were +4, −6 and +5 in 100. What are the MAPE and bias?
Show answer
MAPE: (4 + 6 + 5) ÷ 3 = 5 in 100. Bias: (4 − 6 + 5) ÷ 3 = +1 in 100.
Lesson quiz · 5 questions
Score 60% or more to complete this lesson.
Create a free account to save your progress, take quizzes and earn a certificate.