
SLS-214 · Lesson 5 of 12 · 23 min
Win rates and sales cycle length
▶ Video coming soon A video version of this lesson is on the way.
On October 16 Grace started the session with a puzzle. "Two people in this building will tell you our win rate last quarter. Darnell says it was 52 in 100. The leadership report says 24. They are both right. Before we can talk about whether our win rate is good, we have to agree what it is."
Win rate and sales cycle length were two of the four terms of sales velocity in lesson 4. Both look simple, and both are calculated in several different ways in practice. This lesson defines the main versions, shows when each is useful, and introduces the median, the right way to describe cycle lengths.
What counts as a loss?
A win rate is deals won divided by deals closed. The disagreement is over which closed deals belong in the denominator. Ridgeline's field team closed 125 opportunities in the third quarter: 30 won and 95 lost. The CRM's loss reasons broke the 95 down.
| Outcome | Count |
|---|---|
| Won | 30 |
| Lost to a competitor | 28 |
| No decision (customer kept the status quo) | 38 |
| Lost on price | 11 |
| Timing (customer delayed indefinitely) | 8 |
| No budget | 6 |
| Qualified out by Ridgeline | 4 |
| Total closed | 125 |
Worked problem
Three win rates from the same quarter
Using the table, calculate the overall win rate, the win rate excluding deals that ended in no decision, and the competitive win rate, which compares wins only with losses to a competitor.
Show solution
- Overall: wins divided by all closed opportunities.
- \[\frac{30}{125} = 0.240\]
- Excluding no decision: remove the 38 no-decision losses from the denominator.
- \[\frac{30}{125 - 38} = \frac{30}{87} = 0.345\]
- Competitive win rate: wins divided by wins plus losses to a competitor.
- \[\frac{30}{30 + 28} = \frac{30}{58} = 0.517\]
Answer: The overall win rate is 24 in 100, the rate excluding no decision is about 34 in 100, and the competitive win rate is about 52 in 100. Darnell was quoting the competitive rate; the leadership report used the overall rate.
Each version answers a different question. The competitive win rate asks, "When we go head to head with a competitor, how often do we win?" Ridgeline's 52 in 100 says its proposals and prices hold up well against rivals. The overall rate asks, "Of everything we worked to a conclusion, how much did we win?" It is the right rate for velocity and for planning, because the time spent on deals that ended in no decision was spent all the same. The gap between the two, 38 no-decision losses against 28 competitive losses, was the most important finding of the session: Ridgeline lost more deals to customers doing nothing than to all its competitors combined.
This is a common pattern in B2B sales, and SLS-211 discussed research suggesting that many deals end in no decision because buyers fear making the wrong choice. For Grace, the practical point was that the team's biggest opportunity was not beating competitors but helping buyers decide, which pointed to discovery, business cases and mutual action plans.
Counting deals or counting dollars
Win rates can also be calculated by value instead of by count. A value win rate divides the value of deals won by the value of all deals closed.
Worked problem
Win rate by value
In the third quarter, the 30 won deals had a first-year value of 591,000 dollars, and the 95 lost deals had a first-year value of 2,140,000 dollars. What was the value win rate?
Show solution
- Total value closed.
- \[591{,}000 + 2{,}140{,}000 = 2{,}731{,}000 \text{ dollars}\]
- Value won divided by value closed.
- \[\frac{591{,}000}{2{,}731{,}000} = 0.216\]
Answer: The value win rate was about 21.6 in 100, a little below the count win rate of 24, which means Ridgeline won its smaller deals more often than its larger ones.
When the value win rate is well below the count win rate, a team is winning small deals and losing big ones. That can mean it is less competitive on complex deals, or that large deals are more likely to end in no decision. In the third quarter the gap was modest, but Grace flagged it for the case study in lesson 12.
Win rate by segment
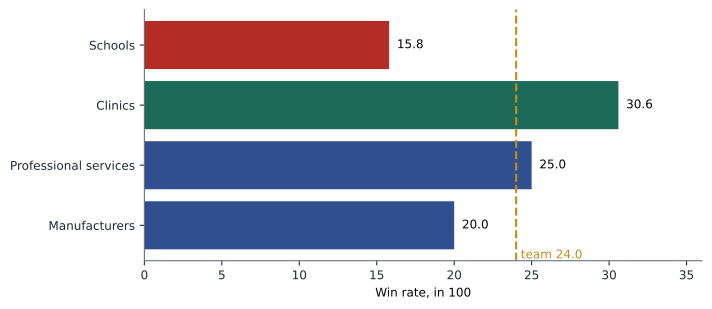
Team win rates also hide differences between kinds of customer. Grace split the third quarter by segment.
| Segment | Won | Closed | Win rate |
|---|---|---|---|
| Schools and school divisions | 3 | 19 | 15.8 in 100 |
| Clinics and health care | 11 | 36 | 30.6 in 100 |
| Professional services | 10 | 40 | 25.0 in 100 |
| Manufacturers | 6 | 30 | 20.0 in 100 |
| Total | 30 | 125 | 24.0 in 100 |
Schools stood out. School business offices slow down sharply over the summer, and many of the school opportunities that closed in July and August closed as "timing" or "no decision". The same schools might well buy in the fall. That observation mattered for the forecast in lessons 7 and 8, and for the diagnosis in lesson 12: part of the third-quarter shortfall was seasonal, not a decline in skill.
Sales cycle length
Sales cycle length is the time from creating an opportunity to closing it. Ridgeline measures it from the date an opportunity enters Qualify to the date it is closed as won. Some companies measure from the first contact, which makes cycles look longer; what matters is measuring the same way every time.
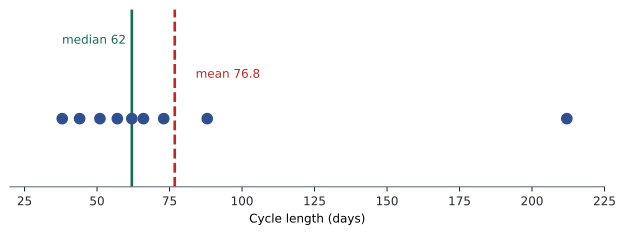
Cycle lengths are almost always skewed: most deals close within a typical range, but a few take far longer. A school division contract that needs board approval, or a manufacturer that pauses a project for six months, stretches the tail. That makes the average, or mean, a misleading summary, because one long deal pulls it up. The median, the middle value when the cycle lengths are sorted, is much more stable.
Worked problem
Mean and median cycle length
Lisa Tran, one of Ridgeline's account executives, won nine deals in the third quarter. Their cycle lengths in days were 38, 44, 51, 57, 62, 66, 73, 88 and 212. The last was a school division that waited for a board meeting. Calculate the mean and the median.
Show solution
- Add the nine cycle lengths.
- \[38 + 44 + 51 + 57 + 62 + 66 + 73 + 88 + 212 = 691\]
- Divide by the number of deals for the mean.
- \[\frac{691}{9} \approx 76.8 \text{ days}\]
- The values are already sorted. With nine values, the median is the fifth.
- \[\text{median} = 62 \text{ days}\]
Answer: The mean is about 76.8 days, but the median is 62 days. One 212-day deal pulled the mean up by about 15 days; the median better describes a typical deal.
With an even number of values, the median is halfway between the two middle ones. Maya's four wins took 21, 28, 35 and 46 days, so her median is halfway between 28 and 35, which is 31.5 days. Her mean is 32.5 days. The two are close because none of her deals was unusual, and both are short because new sellers' first wins are often the easiest deals, such as referrals and renewals of existing equipment.
Cycle length by deal type
Different products take different amounts of time to sell. Grace's third-quarter medians made this plain.
| Deal type | Median cycle (days) | Why |
|---|---|---|
| Furniture only | 41 | Simple purchase, one decision-maker |
| Managed print | 49 | Lease timing and a finance review |
| RoomFlow and video rooms | 84 | Customer IT must review security and network access |
| Mixed solutions | 96 | Several stakeholders and a business case |
The RoomFlow figure explained much of the longer third-quarter cycle in lesson 4. Earlier in 2026, many customers' IT teams had tightened their reviews of cloud software, and RoomFlow deals were waiting weeks for approval. Ridgeline responded in September by preparing a standard security package for customers' IT teams, which SLS-140 mentioned. Grace expected RoomFlow cycles to shorten as a result, and planned to check that claim with the fourth-quarter data.
Using win rates and cycles in planning
Win rate and cycle length together tell a seller when today's work will pay off and how much work is needed. A seller who creates ten opportunities this week, with a median cycle of 60 days and a win rate of 24 in 100, can expect about two or three of them to close as won about two months from now. For Maya, whose quarter ended on November 30, this meant that opportunities she created after the middle of October would mostly close in the next quarter, not this one.
Grace also showed Maya how to read her own numbers honestly. Ten closed opportunities, 4 won and 6 lost, gave Maya an overall win rate of 40 in 100, well above the team's 24. But ten deals is a small sample, and her wins included a referral and a renewal of an existing customer's equipment. Grace suggested Maya plan with the team's rate until she had at least 30 closed opportunities of her own.
Win rates over time and by seller
A single quarter's win rate is a small sample for a seller and a reasonable one for a team. Grace reported team win rates quarterly and seller win rates over a rolling twelve months, which gave each seller enough closed deals for the rate to mean something. Kevin's 30 in 100 over twelve months rested on about 90 closed opportunities; Maya's 4 of 10 rested on ten.
How uncertain is a rate based on a small sample? A rough rule is useful. If a seller has closed n deals, the win rate could easily differ from the true underlying rate by about one divided by the square root of n. For 10 deals that is about 1 ÷ 3.2, or roughly 30 points either way; for 100 deals it is about 10 points. The rule is only approximate, but it shows why Grace would not let anyone draw conclusions from a handful of deals.
Worked problem
How much can a small sample tell us?
Maya has closed 10 opportunities and won 4. Kevin has closed 90 and won 27. Using the rough rule that a rate can differ from the true rate by about one divided by the square root of the number of deals, how precise is each rate?
Show solution
- Maya: the rate is 4 ÷ 10 = 0.40.
- \[\frac{1}{\sqrt{10}} \approx 0.32\]
- Kevin: the rate is 27 ÷ 90 = 0.30.
- \[\frac{1}{\sqrt{90}} \approx 0.11\]
Answer: Maya's 40 in 100 could plausibly be anywhere from about 8 to 72 in 100, so it says little yet. Kevin's 30 in 100 is good to within about 11 points either way.
The same caution applies to differences between sellers. Two sellers with rates of 25 and 30 in 100 over twenty deals each may simply have had different luck. Patterns that persist over several periods, like Andrew's late-stage losses in lesson 3, deserve attention; one-quarter differences usually do not.
Grace added one more practical habit: reviewing a sample of lost deals each quarter, not just counting them. Reading the CRM notes on ten lost deals, and calling two or three of the customers to ask why they chose as they did, often revealed causes that the loss-reason picklist missed. Two of the no-decision losses in the third quarter turned out to be customers who had bought from Ridgeline's leasing partner directly, which the picklist had no way to record. Win-loss interviews like these are among the most useful and least used tools in sales analysis.
Common mistakes
MistakeQuoting a win rate without saying which losses are counted.
InsteadSay whether it is overall, excluding no decision, or competitive, and give the counts.
MistakeUsing the competitive win rate for planning.
InsteadPlan with the overall rate, because time spent on no-decision deals is still spent.
MistakeDescribing cycle length with the mean.
InsteadUse the median, because a few long deals skew the mean.
MistakeComparing cycle lengths measured from different starting points.
InsteadMeasure every deal from the same event, such as entry into Qualify.
MistakeIgnoring the value win rate.
InsteadCompare it with the count win rate to see whether large deals are being lost.
Summary and key terms
- A win rate is deals won divided by deals closed, but which losses are counted changes the answer.
- In Ridgeline's third quarter, the overall win rate was 24 in 100, about 34 excluding no decision, and about 52 in head-to-head competition.
- More deals were lost to no decision than to competitors.
- The value win rate, about 21.6 in 100, was slightly lower, showing larger deals were lost more often.
- Segments differed sharply; schools won only about 16 in 100 over the summer.
- Cycle lengths are skewed, so the median describes a typical deal better than the mean: Lisa's median was 62 days against a mean of about 76.8.
- RoomFlow deals took longest because of customer IT reviews.
- Win rate
- Deals won divided by deals closed, with the counted losses stated.
- Competitive win rate
- Wins divided by wins plus losses to a competitor.
- No decision
- A loss where the customer kept the status quo instead of buying from anyone.
- Value win rate
- Value of deals won divided by value of deals closed.
- Median
- The middle value of a sorted list, or the average of the two middle values.
- Skewed
- Describes data where a few values are much larger than most, pulling the mean away from the median.
Practice problems
Work each problem on paper first, then reveal the answer to check.
A team closed 80 deals: 20 won, 15 lost to competitors and 30 to no decision, with the rest lost for other reasons. What are the overall and competitive win rates?
Show answer
Overall: 20 ÷ 80 = 25 in 100. Competitive: 20 ÷ 35 ≈ 57 in 100.
Find the median of 30, 41, 45, 52 and 140 days.
Show answer
The middle value is 45 days.
Why should a new seller plan with the team win rate?
Show answer
Her own rate rests on too few deals to be reliable.
Lesson quiz · 5 questions
Score 60% or more to complete this lesson.
Create a free account to save your progress, take quizzes and earn a certificate.