
PHOT-350 · Lesson 8 of 12 · 33 min
Mapping and photogrammetry fundamentals
Beyond pretty pictures, drones have become one of the most common tools for measuring the world. Construction companies track earthworks, farmers map crop health, municipalities inspect roads, insurers document storm damage and archaeologists record sites, all from overlapping drone photographs processed into maps and 3-D models. This is photogrammetry: measurement from photographs. Its roots go back to the aerial survey cameras of the 1920s (lesson 1), but software that matches thousands of images automatically has made it available to any photographer with a drone. This lesson explains how a mapping mission is planned, what ground sample distance and overlap mean, how structure from motion turns photos into maps, how accuracy is achieved and checked, and where mapping work crosses into regulated land surveying.
What photogrammetry produces
A drone mapping project usually delivers some combination of the following products, each with its own uses.
- Orthomosaic: a single, geometrically corrected image stitched from hundreds of photos, in which every point is shown as if seen from directly above, so distances and areas can be measured like a map.
- Digital surface model (DSM): a grid of heights including buildings, trees and other objects.
- Digital terrain model (DTM): a grid of bare-ground heights, with buildings and vegetation removed, used for contours and drainage.
- Point cloud: millions of 3-D points with colour, which can be measured, classified and used to calculate volumes.
- 3-D mesh: a textured surface model of buildings, sites or objects, used for visualization and inspection.
- Contours, volumes and cross-sections: measurements derived from the models, such as stockpile volumes or cut-and-fill quantities.
Ground sample distance
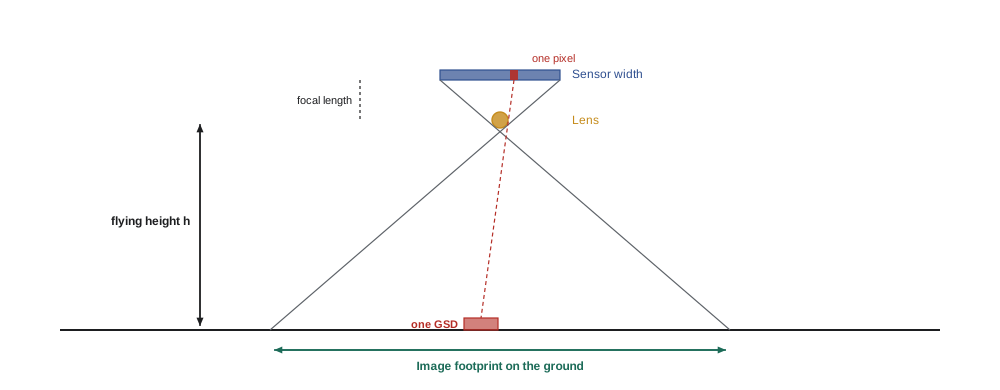
Ground sample distance (GSD) is the size on the ground of one image pixel. A GSD of 2 cm means each pixel covers a 2 cm square. GSD sets the finest detail a map can show and strongly influences accuracy. It depends on the sensor size, image width in pixels, focal length and height above ground.
Worked problem
Working out GSD and footprint
A mapping drone has a 1-inch-type sensor 13.2 mm wide, 5,472 pixels across, with an 8.8 mm lens. It flies at 80 m above ground. What is the GSD, and how wide is each image's footprint?
Show solution
- GSD = 13.2 × 80 ÷ (8.8 × 5,472) m.
- Numerator: 13.2 × 80 = 1,056; denominator: 8.8 × 5,472 = 48,154.
- GSD ≈ 0.0219 m ≈ 2.2 cm per pixel.
- Footprint width = GSD × 5,472 ≈ 120 m.
Answer: About 2.2 cm per pixel, with each image covering about 120 m across.
Worked problem
Choosing altitude for a target GSD
A client wants a 1.5 cm GSD for a road inspection with the same camera. What altitude should the mission use?
Show solution
- Rearrange: h = GSD × focal length × image width ÷ sensor width.
- h = 0.015 × 8.8 × 5,472 ÷ 13.2.
- h ≈ 54.7 m.
Answer: About 55 m above ground. Lower flights mean more images, more flight lines and longer processing.
Overlap and flight lines
Photogrammetry software reconstructs 3-D positions by finding the same features in several photos taken from different positions. Every point on the ground should therefore appear in many images. Mapping missions fly a lawnmower pattern of parallel flight lines, taking photos at regular intervals. Front overlap (along each line) and side overlap (between neighbouring lines) are set as percentages of the image footprint. Typical values are 75 to 80 percent front and 65 to 75 percent side for general mapping, higher over forests, crops, water or uniform surfaces where matching is hard.
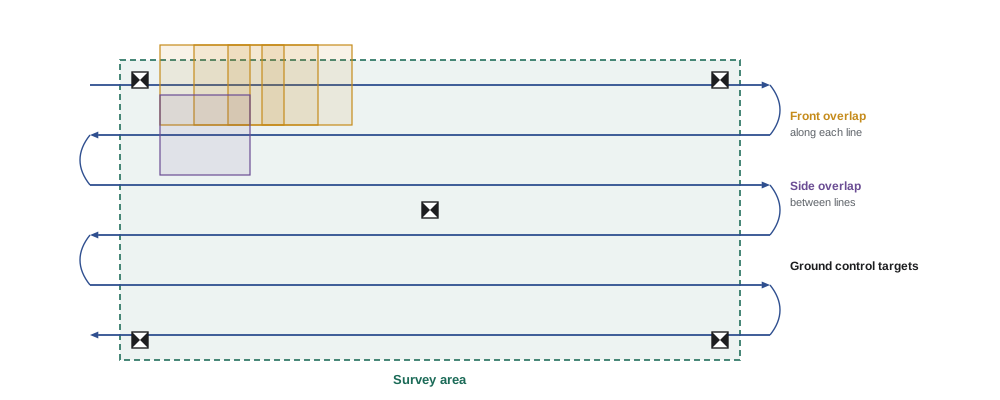
Here W is the footprint width across the flight line and H is the footprint height along it. Cameras are often mounted so the long side of the image runs across the flight line, giving wider line spacing and fewer lines.
Worked problem
Planning a mapping block
A site measures 400 m by 300 m. The camera's footprint at 80 m is 120 m wide (across the line) and 80 m long (along the line). With 70 percent side overlap and 80 percent front overlap, flying lines along the 400 m side at 8 m/s, how many lines, how many photos and roughly how long is the flight?
Show solution
- Line spacing = 120 × (1 − 0.70) = 36 m.
- Lines needed across 300 m: 300 ÷ 36 ≈ 8.3, so 9 lines plus one extra to cover the edge: 10 lines.
- Photo spacing = 80 × (1 − 0.80) = 16 m; photos per 400 m line ≈ 400 ÷ 16 + 1 = 26, plus a few beyond each end: about 30.
- Total photos ≈ 10 × 30 = 300.
- Flight distance ≈ 10 × 400 m + 9 turns × 36 m ≈ 4,300 m; at 8 m/s ≈ 540 s = 9 minutes, plus take-off, climb and turns: about 12 minutes.
Answer: About 10 lines, 300 photos and 12 minutes of flight, which fits on one battery for most mapping drones.
The photo interval in time is the photo spacing divided by ground speed: 16 m at 8 m/s gives one photo every 2 seconds. The camera must be able to save images that fast, and the shutter fast enough to avoid blur (lesson 7). Mission planning apps calculate all of this automatically, but understanding the numbers helps a pilot spot a plan that is unrealistic.
Mapping flights are normally flown at a constant height above the take-off point, which means the GSD changes over hilly ground. Terrain following, which adjusts altitude using an elevation model, keeps the GSD and overlap more consistent on slopes. For 3-D models of buildings, oblique images taken with the camera tilted and orbits around the structure add facades and detail that straight-down images miss.
Structure from motion
Modern drone photogrammetry uses structure from motion (SfM). Software detects thousands of distinctive features in each image, matches them across overlapping images, and solves for both the camera positions and orientations and the 3-D positions of the features at the same time. This produces a sparse point cloud and refined camera positions in a process called bundle adjustment. The software then computes a dense point cloud by matching every pixel it can, builds surface models and a mesh, and projects the images onto the surface to make the orthomosaic.
SfM struggles where features are missing or move. Water, glass, snow fields, bare sand, uniform roofs and repetitive crops give few unique features. Moving shadows, swaying trees, waves and cars create mismatches. Higher overlap, flying at a time of consistent light, and adding oblique images help. Processing is demanding: hundreds of high-resolution images can take hours on a powerful computer, or be uploaded to cloud processing services.
Positioning and accuracy
Two kinds of accuracy matter. Relative accuracy is how well distances and shapes within the map match reality; a well-flown project often achieves relative accuracy of a few GSD. Absolute accuracy is how well positions match real-world coordinates; without help, a drone's ordinary GNSS may place the whole map several metres off.
Three methods improve absolute accuracy:
- Ground control points (GCPs): marked targets placed on the ground and surveyed with precise GNSS or a total station. The software uses them to tie the model to real coordinates.
- RTK (real-time kinematic) positioning: the drone receives corrections from a base station or network during flight, recording each photo's position to a few centimetres.
- PPK (post-processed kinematic) positioning: the drone logs raw GNSS data and corrections are applied after the flight.
Even with RTK or PPK, professionals place check points: surveyed targets that are not used in processing, so the map's accuracy can be tested independently. Accuracy is usually reported as the root mean square error (RMSE) of the differences between the map and the check points.
Worked problem
Reporting accuracy from check points
Five check points show horizontal errors of 2.1, 3.4, 1.8, 2.7 and 4.0 cm between the orthomosaic and the survey. What is the horizontal RMSE?
Show solution
- Squares: 4.41, 11.56, 3.24, 7.29, 16.00.
- Sum: 42.50; mean: 42.50 ÷ 5 = 8.50.
- RMSE = √8.50 ≈ 2.9 cm.
Answer: About 2.9 cm horizontal RMSE, which would be reported with the number of check points and the method.
Coordinates also need a defined reference system: a horizontal datum and map projection, and a vertical datum for heights. Using the wrong system can shift a map by metres or make heights disagree with the client's drawings. The photographer must ask clients which system they use and deliver in it.
In Canada, the national reference frame is NAD83(CSRS), maintained by Natural Resources Canada, and the national vertical datum is CGVD2013, which replaced CGVD28 for many uses; some provinces and municipalities still use older systems. NRCan's free CSRS-PPP service processes GNSS data to precise positions, and provincial networks and commercial RTK networks provide real-time corrections. Map projections commonly used include UTM and provincial systems such as the Modified Transverse Mercator (MTM) in Ontario and Quebec.
Accuracy, GSD and what clients need
A common rule of thumb is that well-controlled projects achieve horizontal accuracy of about 1 to 2 times the GSD and vertical accuracy of about 2 to 3 times the GSD. A client asking for 2 cm vertical accuracy therefore needs a GSD of about 1 cm or finer, plus good control. Agreeing accuracy targets in writing, and explaining what affects them, prevents disappointment. Recognized standards, such as the ASPRS Positional Accuracy Standards for Digital Geospatial Data, give a framework for specifying and reporting accuracy.
| Use | Typical GSD | Control needed |
|---|---|---|
| Marketing or overview map | 3–5 cm | None or drone GNSS only |
| Construction progress | 2–3 cm | RTK/PPK plus check points |
| Stockpile volumes | 2–3 cm | GCPs or RTK, consistent base surface |
| Road or roof inspection | 0.5–1.5 cm | Relative accuracy; control if measurements needed |
| Engineering design surface | 1–2 cm | GCPs and check points, surveyor involvement |
Worked problem
Calculating a stockpile volume
A conical stockpile measured from a drone model has a base diameter of 24 m and a height of 7.5 m. Estimate its volume, and its mass if the material weighs 1.6 tonnes per cubic metre.
Show solution
- Cone volume = (1/3) π r² h.
- r = 12 m, so r² = 144.
- V = (1/3) × 3.1416 × 144 × 7.5 ≈ 1,131 m³.
- Mass ≈ 1,131 × 1.6 ≈ 1,810 tonnes.
Answer: About 1,130 m³, or roughly 1,800 tonnes. Real stockpiles are irregular, so software calculates the volume between the model and a defined base surface.
Mapping and land surveying law
Drone maps look precise, but making measurements that define legal boundaries or are relied on for engineering design can be the regulated practice of land surveying or engineering. Photographers offering mapping services need to know where the line sits in their jurisdiction.
In Canada, land surveying is regulated provincially, and only licensed land surveyors (such as members of the Association of Ontario Land Surveyors or the Ordre des arpenteurs-géomètres du Québec) can carry out cadastral surveys that establish property boundaries; surveys on federal lands fall to Canada Lands Surveyors. Drone operators commonly produce orthomosaics, volumes and progress maps for clients, but should avoid presenting work as a boundary or legal survey, and often partner with a surveyor for control and certification.
Lidar at a glance
Some mapping drones carry lidar sensors instead of, or as well as, cameras. Lidar measures distances with laser pulses and can record several returns per pulse, so it can capture the ground beneath vegetation, which photogrammetry cannot. Lidar is more expensive and produces point clouds without photographic texture unless combined with a camera. Photogrammetry remains cheaper and gives better visual detail on open sites, so many photographers start with it and partner with lidar specialists for forested or corridor projects.
Common mistakes
MistakeFlying a mapping mission at the default overlap over a forest or field of crops.
InsteadRaise front and side overlap where features are repetitive or moving.
MistakeAssuming RTK means no check points are needed.
InsteadUse independent check points to measure and report accuracy.
MistakeDelivering in a coordinate system the client does not use.
InsteadConfirm the horizontal datum, projection, vertical datum and units before flying.
MistakePromising engineering accuracy from a 5 cm GSD.
InsteadMatch GSD and control to the accuracy needed and agree targets in writing.
MistakeCalling a drone map a boundary survey.
InsteadLeave legal surveys to licensed surveyors and describe products accurately.
Summary and key terms
- Photogrammetry turns overlapping photos into orthomosaics, surface models, point clouds and meshes.
- GSD = sensor width × height ÷ (focal length × image width) and sets the finest detail.
- Mapping uses lawnmower flight lines with high front and side overlap.
- Structure from motion matches features to solve camera positions and 3-D points.
- GCPs, RTK or PPK improve absolute accuracy; check points measure it as RMSE.
- Coordinates must use the client's datum, projection and units.
- Boundary and certified engineering surveys are regulated professions; drone mappers should not present work as such.
Practice problems
Work each problem on paper first, then reveal the answer to check.
What is the difference between a DSM and a DTM?
Show answer
A DSM includes buildings and trees; a DTM shows bare ground.
Find the GSD for a 13.2 mm sensor, 5,472 pixels, 8.8 mm lens at 100 m.
Show answer
13.2 × 100 ÷ (8.8 × 5,472) ≈ 2.7 cm.
What altitude gives a 2 cm GSD with that camera?
Show answer
0.02 × 8.8 × 5,472 ÷ 13.2 ≈ 73 m.
A footprint is 100 m wide with 75 percent side overlap. What is the line spacing?
Show answer
25 m.
Along-track footprint 70 m, 80 percent front overlap, speed 7 m/s. Photo interval?
Show answer
Spacing 14 m; interval 2 s.
Why do water and snow cause problems for SfM?
Show answer
They have few unique, stable features to match.
Errors at four check points are 3, 4, 2 and 5 cm. What is the RMSE?
Show answer
√((9+16+4+25)/4) = √13.5 ≈ 3.7 cm.
What does PPK do differently from RTK?
Show answer
Applies GNSS corrections after the flight instead of during it.
Estimate the volume of a cone 18 m across and 5 m high.
Show answer
(1/3)π × 81 × 5 ≈ 424 m³.
Why might a drone mapping business need a licensed surveyor?
Show answer
Boundary and some measurement work is regulated surveying.
Lesson quiz · 5 questions
Score 60% or more to complete this lesson.
Create a free account to save your progress, take quizzes and earn a certificate.