
ROB-310 · Lesson 2 of 12 · 29 min
The Bayes filter and histogram localization
Lesson 1 showed how a single measurement updates a belief through Bayes' rule. A robot, however, does not take one measurement and stop: it moves, senses, moves again and senses again, hundreds of times a second. The Bayes filter is the recursive algorithm that keeps a belief up to date through this cycle, alternating a prediction step, which accounts for motion, with a correction step, which accounts for each new measurement. Every estimator in this course, from the Kalman filter to the particle filter, is an implementation of the Bayes filter with a particular way of representing the belief. This lesson derives the filter, explains the Markov assumption that makes it recursive, and implements it exactly for a robot in a one-dimensional corridor using a histogram, a representation simple enough to compute by hand.
The recursive estimation problem
The robot wants its belief \( bel(x_t) = p(x_t \mid z_{1:t}, u_{1:t}) \), the distribution of its current state given every measurement and control so far. Computing this directly from the full history would get slower and slower as the history grows. The Bayes filter instead computes \( bel(x_t) \) from \( bel(x_{t-1}) \), the latest control \( u_t \) and the latest measurement \( z_t \), so that each update costs the same no matter how long the robot has been running. The previous belief is a sufficient summary of everything that came before.
Two assumptions make this possible, together called the Markov assumption. First, the state is complete: given the current state, the future measurement depends on nothing else from the past, \( p(z_t \mid x_{0:t}, z_{1:t-1}, u_{1:t}) = p(z_t \mid x_t) \). Second, given the previous state and the current control, the current state does not depend on older history, \( p(x_t \mid x_{0:t-1}, z_{1:t-1}, u_{1:t}) = p(x_t \mid x_{t-1}, u_t) \). In words, the state captures everything about the past that matters for predicting the future. This is an idealization. Unmodelled effects such as a slowly drifting gyro bias, people moving through the scene, or a wheel that slips repeatedly on the same patch of floor make errors correlated over time and violate the assumption. The usual remedies are to add the hidden quantity to the state (estimating the gyro bias along with the pose, for example), to inflate noise models so the filter stays cautious, or to reject measurements that do not fit.
Prediction and correction
Under the Markov assumption, the Bayes filter is two equations. The prediction step uses the law of total probability to push the previous belief through the motion model:
For every possible current state, it adds up the probability of having come from each possible previous state. Prediction spreads the belief out, because motion is uncertain: a robot that was fairly sure where it was becomes less sure after driving with slipping wheels. The correction step, or measurement update, applies Bayes' rule with the measurement model:
It multiplies the predicted belief by the likelihood of the measurement at each state and normalizes. Correction usually sharpens the belief, concentrating probability on states consistent with what the sensor saw. A robot running a Bayes filter alternates between these steps, and the shape of its belief breathes in and out: wider after each motion, narrower after each informative measurement. If no measurement arrives, the robot simply keeps predicting, and the belief keeps spreading, which is exactly the right behaviour for dead reckoning.
Representing the belief as a histogram
The Bayes filter equations are exact but involve integrals over continuous states, which cannot be computed in general. The histogram filter makes them computable by dividing the state space into a finite number of cells and storing one probability per cell. The integral in the prediction step becomes a sum, and the correction step becomes an element-wise multiplication followed by normalization:
Histograms can represent any shape of belief, including several separate peaks, which is their great strength. Their weakness is cost: the number of cells grows exponentially with the dimension of the state. A one-dimensional corridor with 1,000 cells is trivial; a planar pose with 10 cm cells over a 50 m by 50 m building and 1° heading bins has 250,000 × 360 = 90 million cells. Histogram filters are therefore used for low-dimensional problems or coarse global localization, while higher-dimensional problems use Gaussians (lessons 5 to 7) or samples (lesson 8).
A corridor example
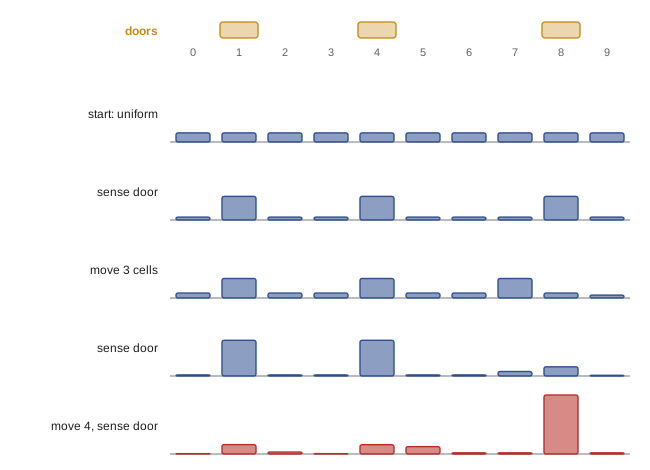
Consider a robot in a corridor of ten cells, numbered 0 to 9, with doors in front of cells 1, 4 and 8. The robot has a door detector that reports "door" with probability 0.8 when it is in front of a door and with probability 0.1 otherwise. When commanded to move one cell to the right, it actually moves one cell with probability 0.8, stays put with probability 0.1 and overshoots by two cells with probability 0.1. The corridor wraps around for simplicity, so moving right from cell 9 leads to cell 0. Initially the robot has no idea where it is: the belief is uniform, 0.1 in each cell.
Worked problem
The first measurement update
Starting from the uniform belief, the robot senses "door". Compute the posterior belief.
Show solution
- Multiply each prior by the likelihood: 0.1 × 0.8 = 0.08 at the three door cells, 0.1 × 0.1 = 0.01 at the seven others.
- Sum: \( 3(0.08) + 7(0.01) = 0.31 \), so \( \eta = 1/0.31 \).
- Door cells: 0.08/0.31 = 0.258 each; other cells: 0.01/0.31 = 0.032 each.
Answer: The belief now has three equal peaks of 0.258 at cells 1, 4 and 8, with 0.032 everywhere else. The sensor cannot tell the doors apart, so the belief is multimodal; a Gaussian could not represent this, but a histogram can.
Worked problem
A prediction step
From the posterior above, the robot moves one cell to the right. Find the predicted probability of cell 5.
Show solution
- Cell 5 can be reached from cell 4 (moved one, probability 0.8), from cell 5 (stayed, 0.1) or from cell 3 (overshot by two, 0.1).
- \( \bar{p}_5 = 0.8(0.258) + 0.1(0.032) + 0.1(0.032) \).
- \( = 0.2064 + 0.0032 + 0.0032 = 0.213 \).
Answer: The predicted probability of cell 5 is 0.213, lower than the 0.258 peak it came from because motion noise leaks probability into neighbouring cells. Each prediction is a convolution of the belief with the motion noise kernel.
After the move, the three peaks sit at cells 2, 5 and 9, each a little lower and wider. None of those cells has a door, so a "no door" reading would now be expected, and it would leave the three hypotheses roughly balanced. The interesting case is a sequence of moves that carries one hypothesis onto another door while the others land on blank wall. Whichever hypothesis predicts the observed sequence of doors and walls accumulates probability, and the others fade. After a few cycles in a corridor with an irregular door pattern, one peak dominates and the robot has localized itself globally, starting from total ignorance.
import numpy as np
doors = np.zeros(10); doors[[1, 4, 8]] = 1
def sense(bel, z):                       # z = 1 means "door"
    like = np.where(doors == 1, 0.8, 0.1) if z else np.where(doors == 1, 0.2, 0.9)
    b = like * bel; return b / b.sum()
def move(bel, u):                        # move u cells right, with slip
    return 0.8*np.roll(bel, u) + 0.1*np.roll(bel, u - 1) + 0.1*np.roll(bel, u + 1)
bel = np.full(10, 0.1)
for z, u in [(1, 3), (1, 4), (1, 0)]:    # sense door, move 3, sense door, move 4, sense door
    bel = sense(bel, z)
    print("after sensing", "door   " if z else "no door", np.round(bel, 3))
    if u: bel = move(bel, u)
print("most likely cell:", int(np.argmax(bel)), " probability:", round(float(bel.max()), 3))after sensing door [0.032 0.258 0.032 0.032 0.258 0.032 0.032 0.032 0.258 0.032] after sensing door [0.013 0.39 0.013 0.013 0.39 0.013 0.013 0.049 0.101 0.007] after sensing door [0.004 0.103 0.022 0.004 0.102 0.081 0.013 0.013 0.645 0.013] most likely cell: 8 probability: 0.645
The code moves the robot three cells and then four cells between sightings. Of the three initial hypotheses (cells 1, 4 and 8), only the one starting at cell 1 sees doors at every sighting (1, then 4, then 8); the one starting at cell 8 matches twice (8, then 1) before landing on blank wall at cell 5, so its probability grows at every step while the others fall. After the second sighting the belief has two equal peaks of 0.39 at cells 1 and 4 (the hypothesis from cell 8 also landed on a door, at cell 1), and after the third it puts about 65 % of its probability on cell 8, with most of the rest spread over the overshoot and undershoot paths. A fourth or fifth sighting would push it above 90 %. The robot localized itself using only a crude binary sensor and noisy motion, because the pattern of doors along its path is distinctive. Corridors with perfectly regular door spacing would never allow this, a real issue in symmetric buildings where robots need extra cues such as signs, Wi-Fi fingerprints or room numbers.
Practical issues
Several practical matters arise even in this simple filter. Probabilities can underflow to zero after many multiplications, so implementations normalize after every update and often work with log-probabilities, where products become sums. A cell whose probability reaches exactly zero can never recover, even if the robot is actually there, so filters keep a small floor probability or inject a little uniform probability each step to recover from mistakes; lesson 8 calls this the kidnapped robot problem. The cell size is a design trade-off: cells that are too large lose precision, while cells that are too small make the filter slow and can cause motion updates to spread probability poorly if the motion per step is less than one cell. Finally, the filter is only as good as its models: if the door detector actually reports false doors 30 % of the time but the filter assumes 10 %, the belief will become overconfident and may lock onto the wrong cell.
Worked problem
Cost of a planar histogram
A warehouse robot uses a histogram filter over x, y and heading in a 40 m by 25 m area with 5 cm cells and 2° heading bins. How many cells are there, and how much memory does storing one 32-bit float per cell need?
Show solution
- Position cells: (40/0.05) × (25/0.05) = 800 × 500 = 400,000.
- Heading bins: 360/2 = 180.
- Total: 400,000 × 180 = 72 million cells.
- Memory: 72 × 10⁶ × 4 bytes = 288 MB.
Answer: About 72 million cells and 288 MB, before counting the work of convolving a three-dimensional motion kernel every update. This is why full-resolution histogram filters are rare for planar localization; coarse grids or particle filters are used instead.
Common mistakes
MistakeLetting cell probabilities fall to exactly zero
InsteadKeep a small floor or mix in uniform probability so the filter can recover from errors.
MistakeSkipping normalization after each update
InsteadNormalize every step, or work in log-probabilities, to avoid underflow.
MistakeAssuming the Markov assumption always holds
InsteadAdd hidden causes such as sensor bias to the state, or inflate noise, when errors are correlated over time.
MistakeChoosing cells smaller than the motion noise can resolve without enough compute
InsteadMatch cell size to the accuracy needed and the computation available.
MistakeExpecting localization in a perfectly symmetric environment
InsteadAdd distinctive cues; symmetric maps leave several hypotheses equally likely forever.
Summary and key terms
- The Bayes filter updates the belief recursively from the previous belief, the latest control and the latest measurement.
- The Markov assumption says the current state summarizes all past information relevant to the future.
- Prediction integrates the motion model over the previous belief and spreads the belief out.
- Correction multiplies by the measurement likelihood and normalizes, usually sharpening the belief.
- Histogram filters store one probability per cell and can represent multimodal beliefs exactly.
- Histogram cost grows exponentially with state dimension, limiting them to low-dimensional problems.
- Practical filters normalize every step, avoid zero probabilities and depend on accurate noise models.
- Bayes filter
- The recursive prediction and correction algorithm for updating a belief.
- Markov assumption
- The assumption that the current state captures all past information relevant to the future.
- Prediction step
- Propagating the belief through the motion model.
- Correction step
- Updating the predicted belief with a measurement using Bayes' rule.
- Predicted belief
- The belief after motion but before the latest measurement.
- Histogram filter
- A Bayes filter that represents the belief as probabilities on a grid of cells.
- Global localization
- Determining the robot's pose from an initially uniform belief.
- Multimodal belief
- A belief with several separate peaks.
- Log-probability
- The logarithm of a probability, used to avoid numerical underflow.
- Complete state
- A state that makes past and future conditionally independent.
Practice problems
Work each problem on paper first, then reveal the answer to check.
Uniform prior over 5 cells; likelihood 0.9 at one cell and 0.1 elsewhere. Posterior at that cell?
Show answer
\( 0.18/(0.18 + 0.08) = 0.692 \).
Which step spreads the belief out?
Show answer
The prediction step.
A cell has prior 0.4; neighbours 0.3 each. Motion: stay 0.6, move left 0.2, move right 0.2. Predicted value at the cell (wrapping, three cells)?
Show answer
\( 0.6(0.4) + 0.2(0.3) + 0.2(0.3) = 0.36 \).
How many cells for a 20 m corridor at 2 cm resolution?
Show answer
1,000.
Why work with log-probabilities?
Show answer
Products become sums and tiny probabilities do not underflow.
What is the likelihood ratio of a sensor with 0.8 hit and 0.1 false alarm rates?
Show answer
8.
Name one way to model a slowly drifting gyro bias without breaking the Markov assumption.
Show answer
Add the bias to the state and estimate it.
What happens if a cell probability reaches zero?
Show answer
It can never recover, even if the robot is there.
A planar grid has 10⁵ position cells and 72 heading bins. How many cells?
Show answer
7.2 million.
Why can a symmetric corridor prevent localization?
Show answer
Several hypotheses predict the same measurements and stay equally likely.
Lesson quiz · 5 questions
Score 60% or more to complete this lesson.
Create a free account to save your progress, take quizzes and earn a certificate.