
VIS-110 · Lesson 11 of 12 · 24 min
Meters, histograms and exposure tools
Exposure decides how the light in a scene maps onto the tones of the final image: which areas become bright, which become dark, and what detail survives at either end. Getting it right requires measurement, because the eye adapts and cannot judge absolute light levels, and because camera screens can be misleading in bright sunlight or dim rooms. Image makers use handheld light meters, the camera's built-in metering, and electronic exposure tools such as histograms, waveforms, false colour and zebras. This lesson explains reflected and incident metering, why meters aim for middle grey, how to handle scenes that fool reflected meters, spot metering and the Zone System, histograms and how to read them, waveform monitors, false colour and zebras for video, and how to use these tools together to place tones deliberately.
Reflected and incident metering
A reflected light meter, including the meter built into every camera, measures the light reflected from the subject toward the camera, that is, luminance. An incident light meter measures the light falling on the subject, illuminance, usually through a white hemispherical dome held at the subject's position and pointed toward the camera or the light.
Every meter is calibrated to recommend an exposure that renders what it measures as a middle tone. For a reflected meter, that means whatever the meter points at will be rendered as middle grey, regardless of whether it is a white wall, a black cat or a grey card. An incident meter avoids this problem because it measures the light, not the subject: if the exposure is set from an incident reading, white objects come out white, black objects black and middle tones in the middle, as long as they are all in the same light.
| Feature | Reflected metering | Incident metering |
|---|---|---|
| Measures | Light reflected from the subject (luminance) | Light falling on the subject (illuminance) |
| Where | From the camera position | At the subject position |
| Strengths | Built into cameras; measures any area; works for distant subjects | Not fooled by subject reflectance; consistent across shots |
| Weaknesses | Fooled by very light or dark subjects | Needs access to the subject's light; does not show scene contrast directly |
Middle grey and fooled meters
Middle grey corresponds to an object reflecting roughly 18 % of the light falling on it, which looks halfway between black and white to our eyes (meter calibrations differ slightly, often closer to 12 % to 14 % in practice). Because reflected meters render everything as middle grey, they are fooled by scenes that are predominantly light or dark:
- A snow scene or a white beach, metered without compensation, comes out grey and underexposed. Add exposure, typically one to two stops.
- A black dress on a dark background, metered without compensation, comes out grey and overexposed. Reduce exposure, typically one to two stops.
- Backlit subjects against a bright sky become silhouettes when the meter averages the sky; meter the subject's face or add fill.
Modern cameras use multi-zone (matrix or evaluative) metering that compares the scene with a database of patterns, which handles many situations well but not all. Exposure compensation adjusts the meter's recommendation in thirds or halves of stops. A grey card placed in the subject's light and metered with a reflected meter gives the same result as an incident reading.
Worked problem
Exposing for snow
A camera meter, pointed at a sunlit snowfield, recommends f/16 at 1/1,000 s at ISO 100. The snow reflects about 85 % of the light. How should the exposure be adjusted so the snow looks white with detail?
Show solution
- The meter wants to render the snow as middle grey (about 18 %).
- The ratio 85 ÷ 18 ≈ 4.7, about 2.2 stops.
- To keep detail in the snow, place it about 1.7 to 2 stops above middle grey: open up about 2 stops, to f/8 at 1/1,000 s (or f/16 at 1/250 s).
- Check the histogram or zebras to confirm that the snow is bright but not clipped.
Answer: Increase exposure by about 2 stops from the meter reading. The sunny 16 rule (f/16 at 1/100 s at ISO 100) gives almost the same answer, because both are based on the light, not the snow.
Spot metering and the Zone System
A spot meter (or a camera's spot metering mode) measures a very small area, often 1° to 3°, allowing the image maker to measure the brightness of individual parts of a scene: a face, the sky, a shadow, a highlight. Measuring several spots reveals the scene's contrast range in stops (Lesson 5).
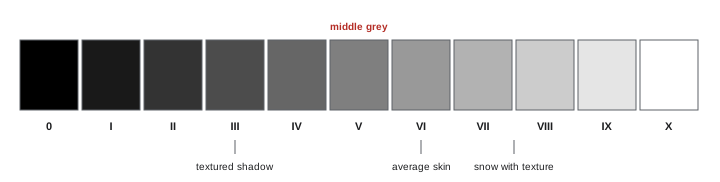
The Zone System, developed by Ansel Adams and Fred Archer for black-and-white photography, divides the tonal scale into zones one stop apart, from Zone 0 (pure black) through Zone V (middle grey) to Zone X (pure white). Textured shadows fall around Zone III, average Caucasian skin around Zone VI, and textured highlights such as white fabric or snow around Zone VII to VIII. The photographer meters a key area, decides which zone it should fall in, and adjusts exposure accordingly: for example, metering a dark rock face and placing it in Zone III means stopping down two stops from the meter's Zone V recommendation. The original system also adjusted film development to expand or compress contrast; the placement principle remains valuable for digital capture and for video exposure.
Histograms
A histogram shows how many pixels fall at each brightness level, from black on the left to white on the right. It does not show whether an exposure is "correct" (a dark scene should have a histogram weighted to the left), but it shows whether tones are being lost: a tall spike against the right edge indicates clipped highlights, and a spike against the left edge indicates crushed shadows. RGB histograms show each colour channel separately, revealing when a single channel clips, such as the red channel in a sunset or a red flower, even though the overall brightness looks fine.
For raw photography, a common technique is "exposing to the right": giving as much exposure as possible without clipping important highlights, which places more image information in the brighter, less noisy part of the sensor's range, then adjusting brightness in processing. Camera histograms are usually based on the processed JPEG preview, so they may show clipping slightly before the raw data actually clips.
Waveforms, false colour and zebras
Video and cinema work use additional tools that relate exposure directly to the recorded signal:
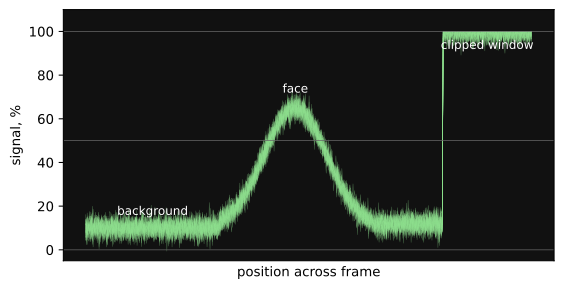
- Waveform monitors plot the brightness of the image from left to right across the frame, with brightness on the vertical axis in percent or IRE units (0 for black, 100 for white in standard video levels). They show exactly where faces, skies and shadows sit and whether anything is clipping, and are the professional standard for exposure and matching cameras.
- False colour replaces the image with colours representing brightness ranges, for example purple for crushed blacks, green for middle grey, pink for typical skin and red or yellow for near-clipping highlights, so exposure of key areas can be read at a glance.
- Zebras overlay striped patterns on areas above a chosen brightness, such as 70 % for skin on standard video or 95 % to 100 % to warn of clipping.
Each camera and recording mode (for example a particular log curve) places middle grey and skin at different signal levels, so these tools must be interpreted with the camera manufacturer's guidance. Viewing through a look-up table (LUT) for display while measuring the log signal is common practice.
Using the tools together
Experienced image makers combine tools: an incident meter to set exposure for the key light and to establish lighting ratios; a spot meter or false colour to check the brightest and darkest areas and see whether they fit within the camera's dynamic range; and histograms or waveforms on the camera to confirm the recorded result. On productions with multiple cameras or shots that must match, consistent metering of the key light and consistent placement of skin tones on the waveform keep shots consistent for editing and grading.
Exposure is ultimately a creative decision: where to place the subject, what to let fall into shadow, what to let clip. Measurement makes that decision deliberate and repeatable rather than a matter of luck.
Exposure for different media
The right exposure depends on how the image will be used. Images destined for print need detail in highlights and shadows within the printable range; images for HDR displays can hold bright highlights that standard displays would clip; images for social media are often viewed on phones at high brightness in varied surroundings. Video shot in log for heavy grading is often exposed slightly brighter than it will finally appear, to reduce noise in shadows, following the camera manufacturer's recommendations. In each case, deciding where key tones should fall, and protecting the highlights and shadows that matter, is the core of the exposure decision.
Practising exposure
Exposure skill grows with deliberate practice. Photograph the same scene at several exposures and compare the results on a calibrated display, noting where detail is lost. Meter a grey card, a white card and a black card in the same light and compare the reflected readings with an incident reading, confirming the two-to-three-stop differences predicted by their reflectances. Watch the histogram and waveform while changing exposure in small steps. Compare the camera's zebras and false colour with the meter readings. These exercises make the tools second nature and build trust in measurement over guesswork.
Finally, remember that consistent exposure across a sequence is often more important than the perfect exposure of a single image, because viewers notice changes between shots more than absolute levels. Metering the key light the same way for every setup is the simplest route to consistency.
Light meters, histograms and waveforms are tools for making informed decisions, not substitutes for judgment. Two image makers measuring the same scene may choose different exposures because they want different moods, one placing a face brighter for an open, optimistic feel, another darker for intimacy or tension. What matters is that the choice is deliberate and that important detail is preserved where the story needs it.
Exposure and noise
Exposure choices affect noise as well as tone. Underexposing and brightening later amplifies noise, especially in shadows, because fewer photons were captured (Lesson 1). Giving the sensor more light, through wider apertures, slower shutters, more light on the subject, or lower ISO where possible, improves image quality. In low light, image makers balance these options: a wider aperture reduces depth of field, a slower shutter risks motion blur, and higher ISO adds noise. Adding light to the scene is often the best solution, which is one reason lighting skills remain essential even as cameras become more sensitive.
With practice, measuring becomes quick and habitual, freeing attention for the creative choices that make an image distinctive.
Common mistakes
MistakeTrusting a reflected reading on snow or black subjects.
InsteadApply compensation or use an incident reading.
MistakeTreating a centred histogram as the correct exposure.
InsteadJudge whether tones are where you intend and whether anything clips.
MistakeIgnoring single-channel clipping.
InsteadCheck RGB histograms for saturated colours.
MistakeJudging exposure on a camera screen in bright sun.
InsteadUse waveforms, false colour or zebras.
MistakeUsing the same zebra or false colour levels for every camera mode.
InsteadFollow the manufacturer's values for each curve.
Summary and key terms
- Reflected meters measure luminance; incident meters measure illuminance at the subject.
- Meters render what they measure as middle grey; compensate for light or dark subjects.
- Spot meters measure small areas and reveal scene contrast.
- The Zone System places key tones in zones one stop apart, with Zone V as middle grey.
- Histograms show tonal distribution and clipping, including per-channel clipping.
- Waveforms, false colour and zebras relate exposure to the recorded signal in video.
- Combining tools makes exposure deliberate and consistent across shots.
- Reflected light meter
- A meter measuring light reflected from the subject.
- Incident light meter
- A meter measuring light falling on the subject.
- Middle grey
- A tone halfway between black and white, about 18 % reflectance.
- Exposure compensation
- Adjusting exposure away from the meter's recommendation.
- Spot meter
- A meter measuring a very small area.
- Zone System
- A method of placing tones in one-stop zones.
- Histogram
- A graph of pixel counts at each brightness.
- Waveform monitor
- A display of brightness across the frame.
- False colour
- An overlay showing brightness ranges as colours.
- Zebras
- Striped overlays marking areas above a set brightness.
Practice problems
Work each problem on paper first, then reveal the answer to check.
What does a reflected meter measure?
Show answer
Luminance, the light reflected from the subject.
Why are incident readings not fooled by white subjects?
Show answer
They measure the light, not the subject's reflectance.
What happens if you expose snow as the meter suggests?
Show answer
It looks grey and underexposed.
How much compensation is typical for snow?
Show answer
About +1 to +2 stops.
What does a spot meter reveal when used on several areas?
Show answer
The scene's contrast range.
Which zone is middle grey?
Show answer
Zone V.
You meter a dark rock and want it in Zone III. How do you adjust?
Show answer
Reduce exposure two stops from the reading.
What does a spike at the right edge of a histogram mean?
Show answer
Clipped highlights.
What does a waveform show?
Show answer
Brightness across the frame from left to right.
What are zebras typically set to for clipping warnings?
Show answer
About 95 to 100 %.
Lesson quiz · 5 questions
Score 60% or more to complete this lesson.
Create a free account to save your progress, take quizzes and earn a certificate.