
CRE-202 · Lesson 2 of 12 · 27 min
Metric definitions and pitfalls
A number on a dashboard is only meaningful if you know exactly what it counts. "Views", "reach", "engagement" and "watch time" sound simple, but each platform defines them in its own way, often differently from other platforms and sometimes differently from its own definitions a year earlier. Comparing metrics without checking definitions is one of the most common sources of bad decisions and misleading reports. This lesson covers why definitions matter, how platforms define common metrics, how definitions change, sampling, delays and rounding, counted versus unique measures, denominators, survivorship and selection bias, correlation and causation, and a checklist for reading any metric.
Why definitions matter
Consider "views". On one platform, a view might be counted the moment a video starts playing; on another, only after several seconds; on another, each replay counts as a new view; on another, only one view per person per period counts. A video with 100,000 views on one platform may have been watched for longer, in total, than a video with 300,000 views on another. Similarly, "engagement" may include likes, comments, shares and saves on one platform, and also link clicks, profile taps and follows on another. Without knowing the definitions, comparing numbers across platforms, or even across time on the same platform, can be meaningless.
Recent definition changes
Platforms change definitions regularly, and creators need to notice when they do. Two prominent examples from 2025 show the effect:
- Instagram replaced "impressions" and "plays" with a single "views" metric across Insights and its business tools, counting each time content is displayed or starts playing, including repeat views, so that photos, carousels, Reels and stories are measured consistently. Historical comparisons with older "impressions" or "reach" figures must take this into account.
- YouTube changed how Shorts views are counted from 31 March 2025, counting a view each time a Short starts to play or replay, with no minimum watch time, aligning with other short-form platforms. The earlier definition, which required a short amount of viewing, continued as "engaged views" in YouTube Studio and remained the measure used for some monetization and eligibility purposes.
When a definition changes, view counts can jump or fall without any change in real audience behavior. Annotate your own records with the dates of such changes, and explain them to brand partners when reports cross the boundary.
Counts and unique measures
Many metrics come in two forms. Count metrics, such as views or impressions, count every event, including repeats by the same person. Unique metrics, such as reach or unique viewers, count each person once in a period. The ratio between them, often called frequency, shows how many times on average each person saw the content.
Reach figures across days cannot simply be added together: someone reached on Monday and again on Tuesday is counted once in a weekly reach figure but twice if daily figures are summed. Platforms often estimate unique counts using statistical methods, so reach is sometimes labeled "estimated". Brands buying exposure care about both: reach tells them how many people saw a message, frequency how often.
| Kind of metric | Example | Counts repeats? | Can be summed across days? |
|---|---|---|---|
| Count | Views, impressions, plays | Yes | Yes |
| Unique | Reach, unique viewers, accounts reached | No | No (overlaps) |
| Duration | Watch time, average view duration | Yes (time adds) | Watch time yes; averages no |
| Rate | Engagement rate, click-through rate | Depends on definition | No (recalculate from totals) |
Denominators
Every rate has a numerator and a denominator, and the choice of denominator changes the meaning. Engagement rate can be calculated per follower, per reach, per impression or per view, and results differ widely: a post with 500 engagements, 10,000 followers, 20,000 reach and 30,000 views has an engagement rate of 5 % by followers, 2.5 % by reach and about 1.7 % by views. None is wrong, but they answer different questions. Per-follower rates suit comparisons of accounts; per-reach or per-view rates suit comparisons of content. When reading any rate, ask what the denominator is, and when reporting one, state it clearly. Lesson 4 returns to engagement rates in detail.
Worked problem
Same post, three engagement rates
A carousel receives 1,200 likes, 80 comments, 150 shares and 370 saves. The account has 40,000 followers; the post reached 30,000 accounts and was viewed 45,000 times. Calculate engagement rate by followers, by reach and by views.
Show solution
- Total engagements: 1,200 + 80 + 150 + 370 = 1,800.
- By followers: 1,800 ÷ 40,000 = 4.5 %.
- By reach: 1,800 ÷ 30,000 = 6.0 %.
- By views: 1,800 ÷ 45,000 = 4.0 %.
Answer: 4.5 % by followers, 6.0 % by reach and 4.0 % by views; always state the denominator.
Delays, sampling and rounding
Analytics are rarely instant and exact. Platforms may show real-time estimates that are later revised; filter out views judged invalid, such as bot traffic or repeated automated plays, lowering counts after a few days; round numbers or show ranges for small audiences to protect privacy; hide demographic breakdowns below minimum thresholds; and sample data for some reports. Revenue figures are often estimates until finalized at the end of a payment period. Third-party tools that pull data through platform interfaces may show different numbers from the native app because of timing, definitions or limits on what the interface provides. When numbers disagree, check the date the data were retrieved, the time zone, the definition and whether the figures are final.
Time zones and dates
Analytics dashboards report days in a particular time zone, often the creator's account setting or the platform's headquarters time. Posting at 11 p.m. local time may place most of a post's first-day performance in the next reporting day. When comparing days of the week, posting times or campaign periods, make sure all data use the same time zone. Brand campaigns that span time zones should agree on the reporting zone in advance.
Selection and survivorship bias
Analytics only show people who saw your content. If you look only at the comments on your most popular videos, or only at the audience that stayed to the end, you see a selected group that may differ from everyone else. Survivorship bias occurs when we study only the successes: studying the habits of creators with millions of followers and concluding that those habits cause success ignores the many creators who did the same things without success. In your own data, comparing only the posts you remember, or only the posts you chose to promote, can mislead. Look at all content in a period, including failures, and be cautious about drawing lessons from a handful of hits.
Correlation and causation
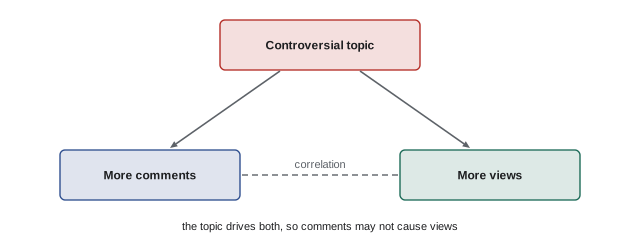
Two metrics moving together does not mean one causes the other. Videos with more comments might get more views because comments boost distribution, because more viewers produce more comments, or because controversial topics produce both. Posts published on Fridays might perform better because of the day, or because the creator happens to publish their strongest content on Fridays. Seasonal effects, such as holidays, school terms and major events, affect whole audiences. To move from correlation toward causation, compare like with like, look for consistent patterns across many posts, consider alternative explanations, and where possible run controlled experiments (Lesson 10).
Platform comparisons
Creators often want to know which platform performs best. Direct comparisons are tricky, because views, watch time and engagement are defined differently, audiences behave differently, and content is presented differently. More meaningful comparisons use outcomes that mean the same thing everywhere: link clicks to the same website, email sign-ups, product sales, or time spent with content. Within a platform, compare content with content. Across platforms, compare the business or audience outcomes that each platform delivers for the effort it takes. CRE-201 discussed platform differences; Lesson 9 shows how to bring data from several platforms into one spreadsheet.
A checklist for reading any metric
Before relying on a number, ask:
- What exactly does it count, and has the definition changed recently?
- Is it a count, a unique measure, a duration or a rate? What is the denominator?
- What time window and time zone does it cover, and is it final or provisional?
- Is it from the platform itself or a third-party tool?
- What is it being compared with, and is that comparison fair?
- What decision would this number change?
Writing short definitions for your own KPIs, in a document or the first tab of your analytics spreadsheet, keeps you and any collaborators consistent.
Platform metric glossaries
Every major platform publishes help pages defining its analytics metrics, and these pages are the authoritative source when definitions are unclear. YouTube Studio explains impressions, click-through rate, views, engaged views, watch time and retention; Meta's Professional Dashboard and Business Suite explain views, reach, interactions and follower metrics for Instagram and Facebook; TikTok's creator and business help centers explain video views, average watch time, watched full video and traffic sources; podcast hosts explain their download methodology. Keeping links to these pages in your analytics document, and checking them when numbers change unexpectedly, saves confusion. Third-party tools usually document how they map platform metrics to their own reports.
Comparing periods
Comparisons between periods, such as this month and last month, or this quarter and the same quarter last year, are common in reports. Month-to-month comparisons can be misleading because months differ in length, holidays and seasonal behavior; comparing the same period a year earlier controls for seasonality, though the account itself may have changed. Comparing rolling 28-day windows smooths out weekly patterns. When a single post dominates a period, report results with and without that outlier to show the underlying trend. Always state which periods are being compared and whether definitions changed between them.
Worked problem
Separating trend from outlier
A creator's views rose from 400,000 in September to 900,000 in October. One October video received 450,000 views. Without that video, October views were 450,000. How should the change be described?
Show solution
- Total change: (900,000 − 400,000) ÷ 400,000 = 125 % growth.
- Excluding the outlier: (450,000 − 400,000) ÷ 400,000 = 12.5 % growth.
- The underlying trend is modest growth, plus one exceptional video.
Answer: Report 125 % growth overall, driven by one video, with an underlying increase of about 12.5 %.
Small numbers and percentages
Percentages based on small numbers can be dramatic and misleading. A post with 40 views and 4 shares has a share rate of 10 %, but one more or one fewer share changes it by 2.5 points. Growth from 100 to 200 followers is 100 % growth; from 100,000 to 101,000 is 1 %. When numbers are small, report counts alongside percentages, avoid strong conclusions from single posts, and wait until patterns appear across many posts.
Estimated and modeled metrics
Some metrics are not counted directly but estimated by models. Unique reach across devices, audience demographics, earnings before finalization and some conversion metrics in advertising tools rely on modeling, especially as privacy changes limit tracking across apps and websites. Estimated figures can shift when models are updated. Treat modeled metrics as approximations, prefer directly counted metrics for important decisions where possible, and note in reports which figures are estimates.
Writing metric definitions
A metric definition document for your own use might contain, for each KPI, its name, the exact formula, the data source, the time window, the date the definition was adopted and any known limitations. For example: "Shares per 1,000 reach: (shares + sends) ÷ accounts reached × 1,000; source: Instagram Insights; 7-day window; adopted January 2026; Instagram counts sends and reposts together in some reports." This short document prevents confusion when collaborators join, when platforms change metrics, and when comparing results from different years.
When in doubt about a number, it is better to ask the platform's help resources, a knowledgeable colleague or the tool provider than to build decisions on a misunderstood metric. A few minutes spent checking a definition can prevent months of misguided effort.
Common mistakes
MistakeComparing views across platforms directly.
InsteadCheck definitions and compare equivalent outcomes.
MistakeIgnoring definition changes.
InsteadAnnotate records with change dates.
MistakeAdding daily reach to get weekly reach.
InsteadUse the platform's weekly unique figure.
MistakeReporting rates without denominators.
InsteadState what each rate is divided by.
MistakeTreating correlations as causes.
InsteadConsider confounders and run experiments.
Summary and key terms
- Metric definitions differ between platforms and change over time.
- Instagram moved to views in 2025; YouTube changed Shorts view counting on 31 March 2025.
- Count metrics include repeats; unique metrics count people once.
- Rates depend on the chosen denominator.
- Delays, filtering, rounding and thresholds affect numbers.
- Beware selection bias, survivorship bias and confounding.
- Use a checklist and written definitions for every KPI.
- Definition
- Exact rule for what a metric counts.
- Count metric
- Metric counting every event, including repeats.
- Unique metric
- Metric counting each person once.
- Reach
- Number of unique accounts that saw content.
- Frequency
- Average number of times each person saw content.
- Denominator
- The quantity a rate is divided by.
- Engaged views
- YouTube Shorts views meeting a viewing threshold.
- Survivorship bias
- Studying only successes.
- Confounder
- Third factor affecting two variables.
- Provisional data
- Numbers that may later be revised.
Practice problems
Work each problem on paper first, then reveal the answer to check.
Why compare platform views cautiously?
Show answer
Each platform defines views differently.
What did Instagram replace with views?
Show answer
Impressions and plays.
What does YouTube now call the older Shorts view measure?
Show answer
Engaged views.
Frequency for 60,000 views and 40,000 reach?
Show answer
1.5.
Can daily reach be summed for a week?
Show answer
No, people overlap.
Engagement rate for 900 engagements on 30,000 reach?
Show answer
3 %.
Why might counts drop after a few days?
Show answer
Invalid traffic is filtered out.
What is survivorship bias?
Show answer
Drawing lessons only from successes.
Give an example of a confounder.
Show answer
A controversial topic driving both comments and views.
Name three checklist questions.
Show answer
Definition, kind and denominator, window, source, comparison, decision.
Lesson quiz · 5 questions
Score 60% or more to complete this lesson.
Create a free account to save your progress, take quizzes and earn a certificate.