
CRE-202 · Lesson 3 of 12 · 27 min
Reach, impressions and views
Before anyone can engage with content, they have to see it. Exposure metrics, such as reach, impressions and views, measure how widely content was distributed and how often it was seen. They are the top of every content funnel and the numbers creators look at first, but they are also among the easiest to misread. This lesson covers the funnel from impression to action, the main exposure metrics on major platforms, followers versus non-followers, new versus returning viewers, distribution curves over time, benchmarks against your own baseline, how to diagnose low reach, and how exposure metrics relate to the decisions creators make.
The content funnel
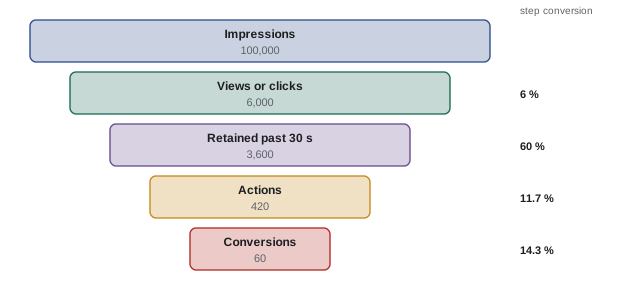
A useful way to think about content metrics is as a funnel. At the top, content is shown to people: impressions or views. Some of those people stop and pay attention, a stage measured by click-through rate on thumbnails or by how many viewers stay past the first seconds of a short video. Some keep watching or reading, measured by retention and watch time. Some act: they like, comment, share, save, follow or subscribe. A smaller number take a deeper step: visiting a website, joining a newsletter, buying a product or becoming a paying member. Each stage loses people, and the conversion rate between stages shows where content succeeds or struggles. A video with high impressions but low click-through has a packaging problem; one with good click-through but poor retention has a content or expectation problem; one with good retention but few follows may lack a reason to come back.
Exposure metrics on major platforms
Each platform reports exposure slightly differently. As of 2026, typical metrics include:
| Platform | Main exposure metrics | Notes |
|---|---|---|
| YouTube | Impressions (thumbnail shown), views, unique viewers, engaged views for Shorts | Impressions count thumbnails shown on YouTube surfaces, not external embeds |
| Views, reach (accounts reached), followers vs non-followers | Views replaced impressions and plays in 2025 | |
| TikTok | Video views, reach, new viewers, traffic source share | Views count plays, including replays |
| Views, reach, viewers, follower share | Aligned with Instagram's views model | |
| Impressions, members reached | Text, document and video posts reported separately | |
| Podcasts | Downloads, starts, listeners or followers | Downloads are not listens; definitions vary by host |
Podcast downloads deserve special caution: a download means a file was requested, not that anyone listened, and automatic downloads by podcast apps can inflate numbers. The IAB Podcast Measurement Technical Guidelines set standards for filtering downloads, and hosting platforms certified against them report more comparable figures. Platform-specific dashboards, such as those of Spotify and Apple Podcasts, report starts, listeners and listening time for their own apps.
Followers and non-followers
Most platforms show how much of a post's reach came from existing followers and how much from people who do not follow the account. Content reaching mostly followers is serving the existing audience; content reaching many non-followers is being recommended to new people, which is how accounts grow. On recommendation-driven platforms, a large majority of views on successful short videos often come from non-followers. Neither is inherently better: a creator with a loyal audience and strong community may deliberately make content mainly for followers, while one trying to grow needs some content that travels to new people. Tracking the follower share over time helps diagnose changes: a falling non-follower share may mean content is less broadly appealing or that recommendation conditions have changed.
New and returning viewers
YouTube and some other platforms report new viewers, returning viewers and, in YouTube's case, groupings such as casual and regular viewers. New viewers indicate reach into new audiences; returning viewers indicate loyalty. A healthy channel usually has both: a base of returning viewers who watch most uploads and a stream of new viewers discovering it. A channel whose returning viewers are declining may be losing its core audience even if total views are stable thanks to a viral video, while a channel with mostly returning viewers and few new ones may have stopped growing. Comparing these groups across content types shows which formats bring new people in and which keep existing viewers engaged.
Distribution over time
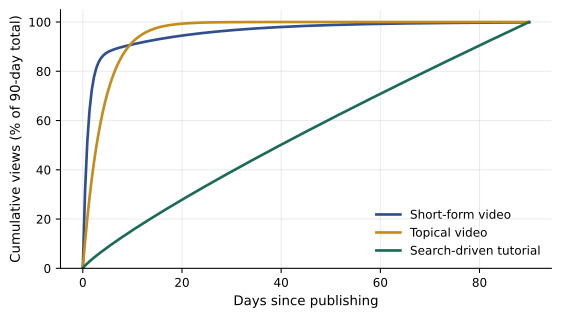
Plotting cumulative views against time since publication shows how content was distributed. Short-form content on recommendation feeds often shows a rapid rise in the first day or two, followed by a plateau, sometimes with a second wave if the system tests it with a new audience. Search-driven content shows a slower start and steady growth for months or years. Topical content spikes and then fades. Comparing the first 24-hour or 7-day performance of a new post with the same window for previous posts gives an early indication of how it will perform overall. Many dashboards show such comparisons, sometimes as a ranking among your recent posts.
Worked problem
Comparing a new post with the baseline
A creator's last 20 Reels reached a median of 8,000 accounts in their first 48 hours, with the middle half ranging from 5,000 to 12,000. A new Reel reaches 19,000 accounts in 48 hours, with 72 % non-followers against a usual 55 %. How should the creator interpret this?
Show solution
- The new Reel reached about 2.4 times the median, well above the usual range.
- The non-follower share is higher, so recommendation to new audiences drove the increase.
- Check engagement and retention rates: if they are also above typical, the content itself likely resonated.
- Note what was different (topic, hook, format, length) and test the idea again before concluding.
Answer: A strong over-performer driven by non-follower distribution; investigate what differed and repeat the idea to confirm.
Baselines and benchmarks
Industry benchmarks, such as average reach or engagement for accounts of a certain size, are published by analytics companies, but they vary widely by niche, platform, method and year, and are often based on samples that may not resemble your account. Your own baseline is a more useful reference: the median and typical range of your recent content on each key metric. A simple baseline uses the last 20 to 30 posts of the same type, recalculated every month or quarter. Comparing new content with this baseline shows whether it performed better or worse than usual, and tracking the baseline itself shows long-term trends. External benchmarks are useful mainly for rough context and for conversations with brands.
Diagnosing low reach
When reach falls, consider several possible causes before drawing conclusions:
- Content: weaker hooks, less broadly appealing topics, lower quality, or content too similar to recent posts.
- Packaging: thumbnails, titles, covers and first frames that attract fewer clicks or stops.
- Audience: seasonal changes, such as summer holidays and exam periods, or shifts in interest.
- Platform: changes in recommendation systems, interface or competition, or temporary bugs.
- Account status: policy issues that reduce recommendation eligibility, which some platforms now report in account status tools (CRE-201).
- Measurement: definition changes, delayed data or filtered views.
Look at the funnel: if impressions are stable but views fell, packaging is the likely issue; if impressions themselves fell, the system is showing content less often, possibly because earlier engagement signals were weak. Compare across content types, since a fall in one format but not another points to content rather than the account.
Exposure and decisions
Exposure metrics are most useful when tied to decisions. They help decide which topics and formats bring new audiences; whether to repurpose a high-reach post into longer content; when to post, if the audience's active hours show a clear pattern; which platforms reach the most relevant people for the effort; and how to price sponsored content, since brands often value reach (Lesson 11). They are least useful as a daily scoreboard. A post that reaches fewer people but brings many email sign-ups or sales may be far more valuable than one that reaches many but leads nowhere, which is why exposure should always be read together with the metrics further down the funnel.
Impressions on different surfaces
Impressions arise on many surfaces within a platform, and the share from each surface affects how other metrics should be read. On YouTube, an impression on the home feed is a viewer scrolling past many options; an impression in search follows a specific query; an impression in suggested videos appears beside another video the viewer chose. Click-through rates differ widely between these surfaces. On Instagram, content may appear in followers' feeds, in Reels, in Explore, on hashtag and audio pages, and in shares through direct messages. Breaking exposure down by surface, where dashboards allow, shows where content is being tested and where it is succeeding, and helps explain why overall rates change as the mix shifts.
Frequency and repeat viewing
High frequency, many views per account reached, can mean different things. For short videos, repeat viewing often indicates people rewatched a loop, a positive signal. For feed posts, high frequency may mean followers saw the same post several times as it resurfaced. For sponsored content, brands care about frequency because a message seen several times is more likely to be remembered, but excessive frequency wastes budget and annoys audiences. Report frequency alongside reach in campaign reports, and compare it with your typical content.
Exposure for stories and ephemeral content
Stories, which disappear after 24 hours on platforms such as Instagram and Facebook, have their own exposure patterns. Most story views come from followers, and views typically fall across a sequence of frames as some viewers tap away, a pattern called story drop-off or completion rate. Exits, forward taps, back taps and replies show how people engaged with each frame. Because stories reach mainly existing followers, their exposure metrics reflect audience loyalty more than discovery. Tracking story reach as a percentage of followers over time is a useful indicator of how many followers remain active.
Worked problem
Story completion
A five-frame story sequence had 4,000 views on the first frame and 2,600 on the last. What is the completion rate, and what would a sharp drop between frames 2 and 3 suggest?
Show solution
- Completion rate: 2,600 ÷ 4,000 = 65 %.
- A sharp drop at frame 3 suggests that frame lost interest, perhaps through a long text block or an off-topic message.
- Compare with other sequences to see whether drops follow similar frames.
Answer: 65 % completion; a drop at frame 3 points to a problem with that frame.
Search impressions
For content discovered through search, impressions depend on search demand and ranking. Search-related analytics, such as YouTube's research tools, search terms reports and external tools that show search volume, reveal which terms bring viewers and which queries the audience is asking. Rising impressions from search over months indicate growing ranking or demand; sudden falls may follow changes in ranking or competing content. CRE-201 Lesson 8 covered search optimization; here, the key point is that search impressions grow slowly and steadily, so search-oriented content should be judged over longer windows than feed content.
Reach as a share of followers
Reach expressed as a percentage of followers is a common way to describe how much of an audience sees content. For feed posts on follower-based surfaces, this percentage is often well below half and tends to fall as accounts grow, because followers may be inactive, see many other accounts or not open the app. For recommended short videos, reach can far exceed the follower count. Tracking the follower reach percentage for stories and feed posts over time shows how engaged the existing audience remains; a steady decline may indicate inactive followers or content that followers find less interesting.
Exposure across platforms in one view
To compare exposure across platforms fairly, choose comparable measures: for example, unique accounts reached per week on each platform, or views of content at least a few seconds long. Combining these in a single weekly chart shows the relative size of each audience and how it changes. Because definitions differ, treat such charts as rough comparisons and note the definitions used.
Common mistakes
MistakeTreating podcast downloads as listens.
InsteadUse IAB-certified downloads and app listening data.
MistakeJudging content by exposure alone.
InsteadRead reach with retention, engagement and conversions.
MistakeComparing a new post with a different time window.
InsteadUse the same 24-hour or 7-day window.
MistakeRelying on generic industry benchmarks.
InsteadCompare with your own baseline.
MistakeBlaming the algorithm for every drop.
InsteadCheck content, packaging, season and measurement first.
Summary and key terms
- The funnel runs from impressions to attention, retention, actions and conversions.
- Exposure metrics differ by platform; check current definitions.
- Podcast downloads are not listens.
- Follower and non-follower shares show whether content reaches new people.
- New and returning viewers indicate growth and loyalty.
- Content accumulates views on different timescales.
- Diagnose low reach through the funnel and your own baseline.
- Impression
- An occasion when content or a thumbnail is shown.
- Funnel
- Sequence of stages from exposure to action.
- Conversion rate
- Share of people moving from one stage to the next.
- Non-follower reach
- Reach among people who do not follow the account.
- New viewers
- Viewers who have not watched recently.
- Returning viewers
- Viewers who have watched before.
- Baseline
- Typical performance of your recent content.
- Benchmark
- External reference value for comparison.
- Download
- Request for a podcast file.
- Distribution curve
- Cumulative views over time since publishing.
Practice problems
Work each problem on paper first, then reveal the answer to check.
What does low click-through with high impressions suggest?
Show answer
A packaging problem.
Conversion from 5,000 views to 150 follows?
Show answer
3 %.
What do YouTube impressions count?
Show answer
Thumbnails shown on YouTube surfaces.
Why are podcast downloads unreliable?
Show answer
Files may be downloaded automatically without listening.
What does a high non-follower share indicate?
Show answer
Recommendation to new audiences.
What do returning viewers indicate?
Show answer
Loyalty.
Describe a search-driven distribution curve.
Show answer
Slow, steady growth over months.
New post at 15,000 vs median 6,000: ratio?
Show answer
2.5 times.
Name three causes of low reach.
Show answer
Content, packaging, season, platform, account status, measurement.
Why read exposure with conversions?
Show answer
High reach may not lead to valuable actions.
Lesson quiz · 5 questions
Score 60% or more to complete this lesson.
Create a free account to save your progress, take quizzes and earn a certificate.