
CRE-202 · Lesson 7 of 12 · 27 min
Audience demographics and behavior
Content metrics describe how posts performed; audience analytics describe the people behind the numbers. Who are they, where are they, when are they online, how do they behave, and what else interests them? Audience data help creators make content for the people they actually reach, choose posting times, decide which languages and formats to use, and show brands whether their audience matches a target market. They also have important limits: they are aggregated, estimated, sometimes inaccurate, and protected by privacy rules. This lesson covers demographic data, geography and language, devices and viewing contexts, activity times, audience behavior and loyalty, audience interests, comparing followers with viewers, qualitative research, personas built on data, and the limits of audience data.
Demographic data
Platforms typically report the age range and gender of followers or viewers, based on information people provide in their accounts and on platform estimates. Age is usually shown in bands, such as 13–17, 18–24, 25–34, 35–44, 45–54, 55–64 and 65 and over, and gender as female, male and sometimes other or unknown. These breakdowns are often shown only for audiences above a minimum size, and only for signed-in users who have provided the information. Demographics can differ between a creator's followers and the viewers of a particular post: a post that went viral may reach a much younger or older audience than usual. For brands, demographic fit with their target market is often the first question; for creators, demographics help decide tone, references, topics and platforms.
| Audience data | Typical source | Common uses | Caveats |
|---|---|---|---|
| Age and gender | Account information and estimates | Tone, topics, brand fit | Bands only; signed-in users; thresholds |
| Country and city | IP address, account settings | Language, time zones, sponsors | VPNs and travel distort |
| Language | App or device settings | Captions, translation, dubbing | Multilingual viewers |
| Device and surface | App data | Format and design choices | Shared devices |
| Active times | Activity patterns | Posting schedule | Averages hide variation |
| Interests and other content | Viewing patterns | Collaboration, topics | Broad categories |
Geography and language
Audience location is reported by country and often by city, usually based on IP addresses and account settings. Geography matters for many decisions: the time zones in which to post and schedule live streams; the languages to use in captions, titles and dubbing; which brands and sponsors are relevant, since many campaigns target specific countries; and monetization, since advertising rates vary widely by country (Lesson 8). A Canadian creator might discover that 40 % of viewers are in the United States, 25 % in Canada and the rest spread across the United Kingdom, Australia, India and elsewhere, which affects spelling choices, references, currency mentions and sponsor relevance. Language reports, based on device or app language settings, can reveal demand for subtitles or translated versions; YouTube's automatic dubbing and multi-language audio tracks have made translated versions more practical.
Devices and viewing contexts
Device data show whether people watch on phones, computers, tablets or televisions. The device shapes the experience: on phones, text must be large and faces close; on televisions, longer, higher-quality content is common, and viewers may watch with others in a living room; on computers, viewers may watch while working. YouTube viewing on connected televisions has grown into a major share of watch time, especially for long-form content, while short-form viewing is overwhelmingly on phones. Knowing the device mix guides thumbnail design, on-screen text size, aspect ratios and length. Some platforms also report whether viewers watched with sound on or off, or through particular surfaces, such as the main feed versus a dedicated video tab.
When the audience is online
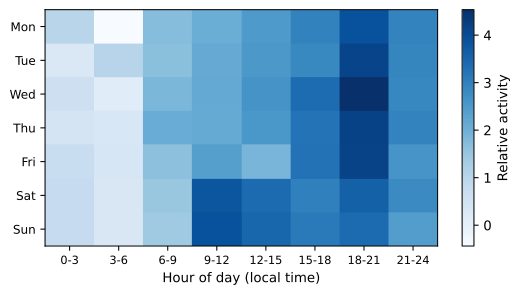
Many dashboards show the days and hours when followers are most active. Posting shortly before peak activity can help content gain early engagement, which matters more on platforms where recent posts are tested quickly with followers. The effect is often smaller than creators expect, especially on recommendation-driven platforms where content can be shown to non-followers for days, and on search-driven platforms where timing matters little. Activity charts are averages: a peak at 8 p.m. may combine many time zones. Rather than following generic "best time to post" articles, test a few posting times over several weeks, keeping other factors similar, and compare early performance against your baseline (Lesson 10).
Behavior and loyalty
Beyond who viewers are, behavior metrics describe how they engage. Useful measures include returning viewer share; the number of viewers who watched several videos in a period; frequency of visits; subscription or follow rate; notification settings, where platforms report how many subscribers receive notifications; and engagement concentration, the share of comments and likes from repeat participants. A creator with a smaller but highly loyal audience may have more influence and business potential than one with a larger, transient audience. Platforms such as YouTube group viewers into new, casual and regular based on how often they watch, a helpful lens for understanding the core audience. Tracking these behaviors over time indicates whether the audience relationship is deepening.
Worked problem
Loyalty versus reach
Creator A has 400,000 subscribers; their videos average 30,000 views, of which 35 % come from returning viewers. Creator B has 60,000 subscribers; their videos average 25,000 views, of which 70 % come from returning viewers. Which audience is likely more loyal, and why might a brand prefer it?
Show solution
- Returning viewers per video: A, 30,000 × 0.35 = 10,500; B, 25,000 × 0.70 = 17,500.
- Views as a share of subscribers: A, 7.5 %; B, about 42 %.
- B has more returning viewers per video and a far more active subscriber base.
- A brand seeking trust and repeated exposure may prefer B despite the smaller subscriber count.
Answer: Creator B has the more loyal audience: 17,500 returning viewers per video and about 42 % of subscribers watching, attractive for trust-based campaigns.
Audience interests
Some platforms show what else an audience watches or follows: other channels, topics or content categories. YouTube's audience tab, for example, has shown other channels and videos the audience watches, and formats the audience watches on YouTube. These insights help identify collaboration partners, content gaps and adjacent topics that the audience already enjoys. They can also reveal a mismatch: if a cooking channel's audience mostly watches gaming content, the channel may be attracting people through a format or personality rather than through cooking. Interest data are broad and probabilistic, so they suggest ideas to test rather than certainties.
Followers versus viewers
Followers are people who chose to follow an account at some point; viewers are people who actually watched recent content. The two groups can differ significantly. Followers accumulated years ago may no longer be active or interested; viewers of recent viral posts may be very different from long-time followers. When reporting audiences to brands, viewer demographics for recent content are often more relevant than follower demographics. When planning content, consider both: serving existing followers maintains loyalty, while understanding new viewers reveals how the audience is changing.
Qualitative audience research
Numbers describe audiences in broad strokes; talking to people adds depth. Qualitative methods include reading and categorizing comments and messages; running polls and question boxes on stories and community tabs; surveys sent to newsletter subscribers or members, with questions about who they are, why they follow, what they want and what they would pay for; interviews with a few loyal viewers; and observing how people use and discuss content in communities. Survey responses come from the most engaged people and may not represent everyone, but they reveal motivations and needs that dashboards cannot show. When asking for personal information, explain why, keep it optional and handle responses carefully (Lesson 12).
Personas built on data
An audience persona is a short description of a typical member of a key audience segment, combining demographics, behavior, interests and motivations: for example, "Priya, 28, a nurse in Toronto who watches meal-prep videos on her phone on Sunday evenings and saves recipes she can cook in under 30 minutes." CRE-110 introduced personas for niche planning; analytics make them evidence-based. Good personas draw on dashboard data, surveys and comments rather than assumptions, and are revised as the audience changes. They help creators imagine a real person while scripting and editing, and help brand partners understand who they will reach. Avoid stereotypes, and remember that personas simplify a diverse audience.
Limits of audience data
Audience data are aggregated and estimated. Age and gender rely on what people report, which may be inaccurate; children may misstate ages; shared family accounts and devices blur demographics; VPNs distort location; and data cover only signed-in users. Platforms apply thresholds and rounding to protect privacy, so small audiences may see little detail. Different platforms use different categories and methods, so comparisons across platforms are approximate. Audience data also say nothing directly about people who never found the content. Treat audience analytics as useful indications, combine them with qualitative research, and avoid making sensitive assumptions about individuals.
Segmenting the audience
Segmentation divides an audience into groups that behave differently, such as new versus returning viewers, followers versus non-followers, viewers from different countries, or subscribers versus casual viewers. Comparing content performance across segments often reveals that a format which looks average overall is excellent for one segment and poor for another. A creator might find that tutorials bring new viewers from search, while personal vlogs are watched mostly by returning viewers; both play valuable roles. Platform dashboards offer some segments directly; others can be approximated by comparing traffic sources or using platform filters. Segments also guide personalization, such as separate playlists, newsletters or communities for distinct groups.
Audience overlap and collaborations
When planning collaborations, knowing how much two audiences overlap helps predict the benefit. Collaborating with a creator whose audience is similar but not already watching you can bring relevant new viewers; collaborating with a creator whose audience already overlaps heavily brings fewer new people. Some platform tools and third-party services estimate overlap; otherwise, comments, shared interests and audience interest reports give clues. After a collaboration, compare new viewers, follows and traffic sources with your baseline to measure its effect.
Worked problem
Measuring a collaboration
A creator normally gains about 150 subscribers per week. In the week after a collaboration video with another channel, they gain 1,050 subscribers, and 40 % of the video's views come from the partner's audience as external or suggested traffic. How many additional subscribers can reasonably be attributed to the collaboration?
Show solution
- Expected subscribers without the collaboration: about 150.
- Observed: 1,050, so about 900 above baseline.
- Part of the increase may come from the video's own appeal, but the traffic mix suggests the partner's audience drove much of it.
Answer: About 900 additional subscribers above the weekly baseline, largely attributable to the collaboration.
Changes in audience over time
Audiences change. Viewers age, interests shift, new platforms attract different groups, and a creator's own content evolves. Comparing audience reports from a year ago with today's shows whether the audience is getting older or younger, more or less international, more or less loyal. A gradual shift may be fine or even intended; an unintended one may indicate that content has drifted away from the original audience or toward a new one. Revisiting personas annually keeps planning grounded in the current audience.
Audience data and inclusive content
Audience data can reveal groups that content serves poorly. If analytics show viewers in many countries but captions only in one language, or a large share watching with sound off, captions and translations may widen access. If comments reveal viewers with disabilities, accessibility improvements such as clear captions, audio descriptions and readable text help. If the audience is narrower than intended, examining whose experiences and perspectives appear in content can make it more welcoming. Analytics can thus support inclusion as well as growth.
Above all, audience analytics should help creators serve real people better. Behind every chart are individuals with their own reasons for watching, and the best use of the data is to understand and respect them.
Common mistakes
MistakeUsing follower demographics as if they described current viewers.
InsteadCheck viewer demographics for recent content.
MistakeFollowing generic best-time-to-post advice.
InsteadTest posting times against your own baseline.
MistakeIgnoring geography and language.
InsteadAdapt captions, references and sponsors to where viewers are.
MistakeEquating large follower counts with loyalty.
InsteadTrack returning viewers and views per subscriber.
MistakeBuilding personas from assumptions.
InsteadBase personas on data, surveys and comments.
Summary and key terms
- Demographics, geography, language and devices describe who the audience is.
- Geography affects posting times, language, sponsors and revenue.
- Device mix guides design, length and format.
- Posting-time effects are modest; test rather than assume.
- Loyalty metrics often matter more than size.
- Interest data and qualitative research add depth.
- Audience data are estimated, aggregated and limited by privacy.
- Demographics
- Age, gender and similar audience characteristics.
- Audience geography
- Countries and cities of viewers.
- Device mix
- Share of viewing on each type of device.
- Active times
- Days and hours when followers are online.
- Returning viewer share
- Share of views from people who watched before.
- Regular viewers
- Viewers who watch consistently over time.
- Audience interests
- Other content and topics the audience watches.
- Persona
- Evidence-based description of a typical audience member.
- Qualitative research
- Non-numerical research such as surveys and interviews.
- Privacy threshold
- Minimum audience size before details are shown.
Practice problems
Work each problem on paper first, then reveal the answer to check.
Name three demographic or audience data types.
Show answer
Age, gender, country, language, device, active times.
Why might a viral post's viewers differ from followers?
Show answer
It reached a broader or different audience.
Name two decisions geography affects.
Show answer
Posting times, language, sponsors, revenue.
Why does device mix matter?
Show answer
It shapes text size, framing, length and format.
Why are posting-time effects often small?
Show answer
Recommendation and search distribute content for days.
Returning viewers for 20,000 views at 45 % returning?
Show answer
9,000.
What does views as a share of subscribers indicate?
Show answer
How active the subscriber base is.
Name two qualitative research methods.
Show answer
Polls, surveys, interviews, comment analysis.
What makes a persona evidence-based?
Show answer
It draws on data, surveys and comments.
Name two limits of audience data.
Show answer
Estimated, self-reported, VPNs, thresholds, signed-in only.
Lesson quiz · 5 questions
Score 60% or more to complete this lesson.
Create a free account to save your progress, take quizzes and earn a certificate.