
CRE-202 · Lesson 5 of 12 · 27 min
Retention curves and watch time
For video and audio, the most revealing analytics are not how many people started watching but how long they stayed. Retention curves show, moment by moment, what share of viewers were still watching, revealing exactly where content held attention and where it lost it. Watch time, the total time people spent with content, combines reach and retention into one measure. This lesson covers how retention is measured, reading absolute and relative retention, typical curve shapes and what they reveal, the critical opening seconds, spikes and dips, average view duration and percentage viewed, watch time, retention for short-form and long-form content, podcasts and live streams, and using retention to improve content.
How retention is measured
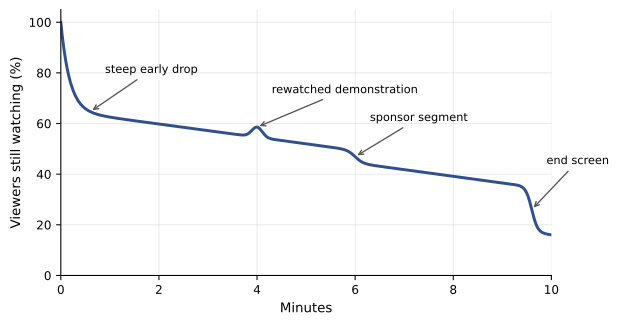
A retention curve, or audience retention graph, plots the percentage of viewers still watching at each point in a video, from 100 % at the start (by definition, everyone who started) down to the share still watching at the end. Because people skip forward and rewind, curves can rise as well as fall: a rewatched section creates a bump, and skipping creates a drop followed by viewers rejoining later. Platforms calculate retention from aggregated viewing data and may show it only once a video has enough views. YouTube Studio shows absolute audience retention and a comparison with typical performance of similar-length videos on the channel, and segments the opening into key moments; short-form platforms show simpler curves or summary statistics such as average watch time and the share who watched to the end.
Absolute and relative retention
Absolute retention shows the percentage of viewers still watching at each moment. Relative retention compares a video's retention with that of other videos of similar length, either on the same channel or across the platform, showing whether it held attention better or worse than typical. A video might have absolute retention of 35 % at the halfway point, which sounds low, but relative retention far above average if similar videos typically hold only 25 %. Relative comparisons matter because retention naturally declines with length: a 30-minute video will almost always have lower percentage retention than a 3-minute one. YouTube's comparison with "typical" performance on the channel is one form of relative retention.
Curve shapes and what they reveal
Common curve features include:
- A steep initial drop: viewers deciding in the first seconds that the video is not what they wanted. Some drop is inevitable, but a very steep one suggests a mismatch between packaging and content, a slow opening or a weak hook.
- A gradual, steady decline: normal; the slope shows how well the content sustains interest. Flatter is better.
- Plateaus: sections that hold everyone who remains, often the core of the content.
- Bumps: sections viewers rewatch, such as a key demonstration, a funny moment or a hard-to-follow step. Bumps can signal value or confusion; check which.
- Dips and cliffs: points where many viewers leave or skip, such as long introductions, sponsor reads, tangents, repeated information or a moment that signals the video is ending.
- An end drop: viewers leaving as the content wraps up; common and expected, though a long outro or end screen can make it larger.
Comparing curves across several videos reveals patterns: if every video drops sharply at the 2-minute mark where a recurring segment begins, that segment may be the problem.
The opening seconds
The first seconds matter most, because that is where the largest share of viewers leave. For long-form video, the share still watching at 30 seconds is a useful indicator of whether the opening delivered on the thumbnail and title promise; YouTube highlights the intro section separately. For short-form video, the share still watching after 2 or 3 seconds, sometimes reported as a hook rate or by comparing views with engaged views, shows whether the first frame and opening line stopped the scroll. CRE-120 and CRE-210 cover hooks in depth; analytics show whether they worked. Testing different openings for similar content and comparing early retention is one of the most productive uses of analytics.
Worked problem
Diagnosing an opening
A creator's last ten tutorials averaged 72 % retention at 30 seconds. A new tutorial with a similar topic and thumbnail retains only 54 % at 30 seconds, then declines at the usual rate. The first 30 seconds contain a channel introduction and a sponsor mention before the tutorial begins. What should the creator conclude and test?
Show solution
- Early retention is 18 percentage points below the creator's baseline, while later decline is normal.
- The problem is concentrated in the opening, where the introduction and sponsor delay the promised content.
- Test moving the sponsor mention later and opening with the result or first step within 5 seconds.
- Compare 30-second retention on the next few tutorials with the baseline.
Answer: The delayed opening likely caused the drop; open with the promised content and move the sponsor later, then compare with the baseline.
Average view duration and percentage viewed
Average view duration (AVD) is the total watch time divided by the number of views: the average number of minutes or seconds each view lasted. Average percentage viewed (APV) is the average view duration divided by the video length. AVD favors longer videos, since a 20-minute video with 30 % APV has an AVD of 6 minutes, while a 5-minute video with 60 % APV has an AVD of only 3 minutes. APV favors shorter videos. Neither alone is the right measure: for long-form, creators often look at both, and at total watch time. For short-form content, average watch time and the share who watched the full video, or watched beyond a few seconds, are common measures; looping videos can show average watch time longer than the video itself because replays count.
Watch time
Watch time, total time spent watching across all views, combines how many people watched and how long they stayed. It matters because platforms that earn advertising revenue from viewing time value content that keeps people watching, and because some monetization eligibility thresholds use watch hours, such as YouTube's partner program requirement of 4,000 public watch hours in the past 12 months for long-form video (with alternatives based on Shorts views). For creators, watch time per video and per week show how much attention content captures overall. A video with fewer views but much longer viewing may deliver more total attention and revenue than a viral short clip.
| Video | Length | Views | APV | AVD | Watch time |
|---|---|---|---|---|---|
| A | 4:00 | 20,000 | 55 % | 2:12 | About 733 hours |
| B | 18:00 | 8,000 | 35 % | 6:18 | About 840 hours |
| C | 0:45 (Short) | 120,000 | 80 % | 0:36 | About 1,200 hours |
Short-form, long-form, podcasts and live
Retention means different things in different formats. In short-form video, viewers are scrolling, so the main questions are whether they stopped, whether they watched to the end, and whether they replayed; a curve that stays high to the end and loops indicates strong content. In long-form video, viewers chose to watch, so the main questions are whether the opening delivered on the promise and whether the middle sustained interest. In podcasts, listening data from platforms such as Spotify and Apple Podcasts show average consumption and drop-off points, often revealing that long introductions or advertisement breaks lose listeners. In live streams, retention is measured as concurrent viewers over time and average watch time per viewer, with spikes at notable moments and drops at breaks. In each format, compare like with like.
Using retention to improve content
Retention data are most useful when connected to specific moments in the content. A practical routine for a new long-form video, a few days after publishing:
- Compare 30-second retention with your baseline.
- Identify the two largest dips or cliffs and watch those moments: what happens just before viewers leave?
- Identify bumps and plateaus: what are viewers rewatching or staying for?
- Compare relative retention with similar videos.
- Write down one change to try in the next video, such as a shorter introduction, a tighter middle, moving a sponsor read, or adding chapter markers so viewers can navigate.
Over many videos, these small changes compound. Retention is also affected by packaging: a misleading thumbnail may increase clicks but cause a steep early drop, which can harm recommendations, so retention and click-through should be read together (Lesson 6).
Limits of retention data
Retention curves are averages across many viewers with different intentions: some wanted a quick answer and left satisfied after a minute; others watched everything. A drop is not always a failure: in a tutorial, viewers who leave after finding the step they needed may be perfectly happy. Small videos with few views produce noisy curves, so patterns should be confirmed across several videos. Retention is also influenced by where viewers came from: viewers from search may watch differently from viewers recommended on the home feed. Segmenting by traffic source, where possible, gives a clearer picture.
Chapters, key moments and navigation
YouTube chapters, created by adding timestamps to video descriptions, let viewers jump to sections. Chapters can change retention curves: some viewers skip to the section they need, creating drops followed by plateaus later in the video. This can lower average percentage viewed while improving satisfaction and search visibility, since chapters may appear in search results. When analyzing retention for videos with chapters, look at which chapters attract the most viewers and which are skipped; this reveals what viewers value most and may suggest standalone videos or shorts for popular sections.
Retention for sponsored segments
Sponsored segments are a common cause of retention drops. Analytics can guide better integration: placing the segment after the hook has delivered value, keeping it concise, making it relevant and entertaining, and integrating it naturally into the content. Comparing the drop at sponsored segments across videos shows which approaches keep viewers. Brands increasingly look at retention through their segment, so a well-integrated sponsorship that keeps viewers watching is valuable to both creator and partner.
Worked problem
Measuring a sponsor segment
Retention is 58 % just before a 60-second sponsor segment and 49 % just after it. In the creator's other videos, retention typically falls by 3 points over a comparable minute of normal content. How much of the drop is attributable to the sponsor segment?
Show solution
- Observed drop: 58 % − 49 % = 9 points.
- Expected drop for normal content: 3 points.
- Extra drop attributable to the segment: about 6 points.
Answer: About 6 percentage points beyond the normal decline, a target for shorter or better-integrated segments.
Retention across a series
For series content, retention across episodes is as important as retention within each episode. The share of viewers of episode 1 who go on to watch episode 2, 3 and so on shows whether the series holds its audience. Playlists and end screens linking episodes, and consistent publishing, support series retention. A sharp drop after a particular episode suggests something about that episode disappointed viewers, while steady numbers suggest a loyal series audience, which is valuable for sponsors and memberships.
Watch time per viewer
Total watch time can rise because more people watch or because each person watches more. Dividing watch time by unique viewers gives watch time per viewer, which shows how much attention each person gives the channel in a period. Rising watch time per viewer suggests deepening engagement, often through series, playlists and longer formats; falling watch time per viewer with rising total watch time suggests growth from casual viewers.
Common mistakes
MistakeComparing percentage retention across very different lengths.
InsteadUse relative retention and AVD alongside APV.
MistakeIgnoring the first 30 seconds.
InsteadTrack early retention against your baseline.
MistakeTreating every dip as failure.
InsteadCheck what happens at the moment and why viewers leave.
MistakeUsing misleading packaging for clicks.
InsteadMatch thumbnails to content to protect retention.
MistakeDrawing conclusions from one small video.
InsteadConfirm patterns across several videos.
Summary and key terms
- Retention curves show the share of viewers still watching at each moment.
- Relative retention compares with similar-length content.
- Drops, plateaus, bumps and cliffs reveal specific strengths and problems.
- The opening seconds lose the most viewers.
- AVD favors long videos; APV favors short ones; use both.
- Watch time combines reach and retention and matters for monetization.
- Use retention moment by moment to make one change at a time.
- Retention curve
- Graph of the share of viewers still watching over time.
- Absolute retention
- Percentage of viewers watching at each moment.
- Relative retention
- Retention compared with similar-length content.
- Hook rate
- Share of viewers who keep watching past the opening seconds.
- Average view duration
- Watch time divided by views.
- Average percentage viewed
- AVD as a percentage of length.
- Watch time
- Total time spent watching content.
- Plateau
- Section where retention stays flat.
- Cliff
- Sharp drop in retention at a specific moment.
- Concurrent viewers
- Number of people watching a live stream at once.
Practice problems
Work each problem on paper first, then reveal the answer to check.
Why can retention curves rise?
Show answer
Viewers rewind and rewatch sections.
What does a steep initial drop suggest?
Show answer
A weak hook or mismatch with packaging.
What might a bump indicate?
Show answer
A section viewers rewatch, valuable or confusing.
AVD for 500 hours over 10,000 views?
Show answer
3 minutes.
APV for a 3-minute AVD on a 12-minute video?
Show answer
25 %.
Watch time for 6,000 views at 5 minutes AVD?
Show answer
500 hours.
Why compare relative rather than absolute retention?
Show answer
Retention declines naturally with length.
What is YouTube's long-form watch-hour threshold for the partner program?
Show answer
4,000 public watch hours in 12 months.
What does a looping short show in average watch time?
Show answer
It can exceed the video length.
Name one retention-based change to try.
Show answer
Shorter intro, move sponsor read, tighten middle, add chapters.
Lesson quiz · 5 questions
Score 60% or more to complete this lesson.
Create a free account to save your progress, take quizzes and earn a certificate.