
CRE-202 · Lesson 9 of 12 · 27 min
Spreadsheets, tracking and dashboards
Platform dashboards are designed for quick checks of one platform at a time. To see patterns across many posts, combine data from several platforms, track results over months and years, and connect content to revenue, creators need their own records. A simple spreadsheet, kept up to date, is one of the most powerful tools a creator can have. This lesson covers why to keep your own data, designing a content log, exporting data from platforms, tidy data principles, essential formulas for averages, medians, rates and growth, pivot tables and grouping, charts that communicate, building a simple dashboard, third-party analytics tools, and a review routine.
Why keep your own data
Platform dashboards have limits: they show data only for that platform, often for a limited period; they change their metrics and layouts; they rarely include information the creator knows, such as the topic, format, hook style, production cost or whether a post was sponsored; and they cannot be combined with revenue from other sources. Keeping your own records lets you compare content across platforms and years, tag posts with attributes to find patterns, connect content to revenue and costs, preserve history if an account is lost or a platform shuts down, and prepare reports quickly. The effort is modest: a few minutes per post, plus a monthly export.
Designing a content log
A content log is a spreadsheet with one row per piece of content and columns for its attributes and results. Useful columns include:
- Identification: date and time published, platform, format, title or description, link.
- Attributes you choose: topic or content pillar, hook type, length, series, sponsored or not, collaboration, thumbnail style.
- Results at fixed windows, such as 7 days and 28 days: views, reach, watch time, average view duration, retention at 30 seconds, likes, comments, shares, saves, follows, link clicks.
- Calculated rates: engagement per 1,000 reach, shares per 1,000, follows per 1,000, click-through rate.
- Business results: revenue, sign-ups, sales, costs.
- Notes: what you tried and what you noticed.
Recording results at fixed windows makes comparisons fair. Start simple, with the metrics that match your KPIs, and add columns only when they answer a real question.
| Column | Example value | Why it matters |
|---|---|---|
| Published | 2026-10-14 18:00 | Timing analysis, windows |
| Platform / format | Instagram / Reel | Compare formats |
| Pillar | Budget recipes | Compare topics |
| Hook type | Result first | Test openings |
| Views (7 days) | 18,400 | Exposure |
| Shares per 1,000 reach | 14.2 | Value signal |
| Follows per 1,000 reach | 3.1 | Growth |
| Revenue / sign-ups | $0 / 42 | Business outcome |
Exporting data from platforms
Most platforms allow exporting analytics: YouTube Studio exports tables of videos with selected metrics; Meta Business Suite and Professional Dashboard export Instagram and Facebook post data; TikTok's analytics allow downloads of recent data for business and creator accounts; podcast hosts export episode downloads; newsletter platforms export open and click rates; shops and affiliate networks export sales. Export periods and available metrics vary and change, and some platforms keep detailed data for only a limited time, so exporting monthly protects your history. Third-party tools can automate collection through platform interfaces (below). When exporting, note the date of export, the time window and the definitions of each metric (Lesson 2).
Tidy data principles
Spreadsheets are easiest to analyze when data are tidy: each row is one observation (one post, one day or one month), each column is one variable, and each cell contains one value. Avoid merged cells, multiple values in one cell, color as the only way to mark information, and totals mixed into data rows. Use consistent formats for dates, numbers and categories: "Reel" and "reels" in the same column will be treated as different categories. Keep raw exported data on separate sheets and build calculations on other sheets, so that new exports can be pasted in without breaking formulas. These habits make filtering, sorting, pivot tables and charts straightforward.
Essential formulas
A handful of spreadsheet formulas cover most creator analytics. In Google Sheets and Excel, these include:
- AVERAGE and MEDIAN to summarize metrics; MEDIAN is often more representative (Lesson 1).
- QUARTILE or PERCENTILE to find the typical range, for example the 25th and 75th percentiles.
- Simple division for rates, such as =shares/reach*1000 for shares per 1,000 reach.
- AVERAGEIFS, MEDIAN with FILTER, and COUNTIFS to summarize subsets, such as the median views of tutorials on Instagram in the last 90 days.
- Growth rates, such as =(this_month-last_month)/last_month.
- Conditional formatting to highlight posts above or below the typical range.
Worked problem
Finding the typical range
A creator's last 12 Shorts had 7-day views of 2,100; 2,800; 3,000; 3,300; 3,500; 3,600; 4,000; 4,400; 5,200; 6,100; 9,800; and 48,000. What are the median and the interquartile range, and how should a new Short with 7,500 views be described?
Show solution
- Sorted values are already in order; the median is the average of the 6th and 7th values: (3,600 + 4,000) ÷ 2 = 3,800.
- Q1, the median of the lower six: (3,000 + 3,300) ÷ 2 = 3,150.
- Q3, the median of the upper six: (5,200 + 6,100) ÷ 2 = 5,650.
- A new Short at 7,500 views is above the typical range (3,150 to 5,650) but far below the viral 48,000.
Answer: Median 3,800; typical range about 3,150 to 5,650; 7,500 views is a solid above-typical result.
Pivot tables and grouping
Pivot tables summarize data by category: for example, median views, shares per 1,000 reach and follows per 1,000 reach for each content pillar and format. They turn a long content log into a compact comparison that reveals patterns, such as "tutorials bring the most follows, behind-the-scenes posts bring the most comments, and sponsored posts perform about 20 % below the median". Grouping by month shows trends; grouping by hook type or length tests hypotheses. With small samples, differences between groups may be noise, so look for differences that are large and consistent, and confirm them with experiments (Lesson 10).
Charts that communicate
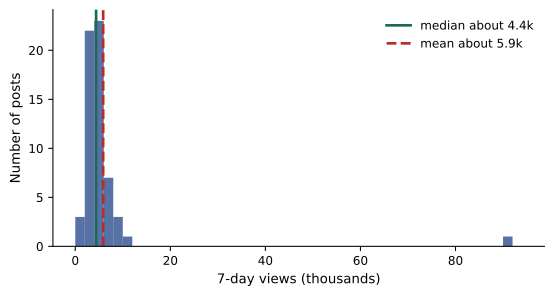
Charts make patterns visible, but poor charts mislead. Good practice includes choosing the chart that matches the question: line charts for trends over time, bar charts for comparisons between categories, scatter plots for relationships between two metrics, such as length and retention, and histograms for distributions, which reveal the skewed, long-tailed shape of social media performance. Start bar charts at zero; label axes and units; avoid three-dimensional effects; use color sparingly and consistently; and annotate important events, such as a definition change or a viral post. A chart should answer one question clearly, and its title can state the answer: "Tutorials bring three times more follows than vlogs".
Building a simple dashboard
A dashboard collects the most important metrics in one view. For an individual creator, a single sheet or page is enough, showing for each month the KPIs for each goal, such as total views, median views per post, follows per 1,000 reach, returning viewers, email sign-ups and revenue by stream; a trend chart for each KPI; a small table of top and bottom posts with notes; and a few lines of insights and decisions. Tools range from spreadsheet tabs and charts to free business intelligence tools such as Looker Studio, which can connect to some platform data sources, to paid analytics platforms. The best dashboard is one you look at regularly and that leads to decisions; complexity is not a virtue.
Third-party analytics tools
Social media management and analytics tools, such as Sprout Social, Hootsuite, Later, Metricool, Dash Hudson and many others, as well as YouTube-focused tools such as vidIQ and TubeBuddy, collect data from several platforms through official interfaces, provide unified reports, compare with competitors and automate reporting. They can save time and offer features platforms lack. Considerations include cost; which metrics each tool can access, since platform interfaces limit what third parties receive; differences in definitions and timing from native analytics; privacy and security, since tools need access to your accounts; and lock-in, since your history may be stored in the tool. Export your data regularly regardless of the tool you use.
A review routine
A simple routine keeps analytics useful without taking over:
- Per post: record results at the 7-day mark in the content log, with a note.
- Weekly (15–30 minutes): review the week's posts against the baseline, read comments, note one or two observations.
- Monthly (1–2 hours): export data, update the dashboard, compare pillars and formats, review revenue and costs, write three decisions for the next month.
- Quarterly: review goals and KPIs, recalculate baselines, and review experiments.
Writing decisions down and checking them later turns analytics into learning.
Automating data collection
Manual data entry becomes tedious as content volume grows. Options for automation include platform exports scheduled monthly; spreadsheet add-ons and connectors that import data from YouTube Analytics, Meta and other platforms through their official interfaces; business intelligence tools with platform connectors; and third-party social media tools that export combined reports. Automation reduces errors and time, but connectors can break when platforms change their interfaces, and access may require granting permissions to third parties. Keeping a manual backup of the most important metrics ensures continuity.
Combining data from several sources
Bringing together data from several platforms, email, shops and affiliates requires a common structure. A practical approach uses one sheet per source with raw exports, a mapping sheet that links each post or campaign across sources with a shared identifier, such as a campaign code or date and title, and a summary sheet that pulls key metrics into one table using lookup functions. Consistent naming, such as including the campaign code in UTM parameters, discount codes and post captions, makes linking much easier.
Worked problem
Building a monthly summary formula
A content log has columns for platform (column B), pillar (column D) and 7-day views (column H). How can the creator calculate the median 7-day views of tutorials on YouTube in a spreadsheet?
Show solution
- In Google Sheets, use =MEDIAN(FILTER(H:H, B:B="YouTube", D:D="Tutorial")).
- In recent versions of Excel, the same FILTER and MEDIAN combination works.
- Copy the formula for each combination of platform and pillar to build a summary table.
Answer: Use MEDIAN combined with FILTER on the platform and pillar columns, then build a table of results.
Annotations and context
Numbers without context are easy to misinterpret later. Adding an annotation column or a separate events sheet that records things like platform definition changes, viral posts, collaborations, holidays, equipment changes, posting breaks and algorithm updates reported by platforms makes it possible to explain changes months or years afterwards. Many charts benefit from annotated markers at these dates.
Data quality checks
Before drawing conclusions, check data quality: missing values, duplicated rows, inconsistent category names, numbers stored as text, dates in different formats and results recorded at inconsistent windows. Simple checks, such as counting rows by month, sorting to find extreme values, and filtering for blank cells, catch most problems. Clean data make every later analysis more trustworthy.
Visualizing retention and funnels
Retention curves exported as data can be charted to compare several videos on one graph, for example by plotting the curves of the five most recent videos with their percentage retention on the vertical axis and the percentage of video length on the horizontal axis, so that videos of different lengths can be compared. Funnel charts showing impressions, views, retained viewers, actions and conversions for each piece of content, or for each month, make it easy to see where audiences are lost. These visualizations make patterns obvious that are hard to see in tables of numbers.
Sharing dashboards
When sharing dashboards with collaborators or partners, decide what each person needs to see. A brand partner might see only campaign metrics; an editor might see retention and feedback for videos they edited; a manager might see revenue and growth. Shared views with appropriate permissions keep sensitive information private.
Common mistakes
MistakeRelying only on platform dashboards.
InsteadKeep your own content log and monthly exports.
MistakeMessy spreadsheets with merged cells and mixed formats.
InsteadUse tidy data principles.
MistakeSummarizing with means only.
InsteadUse medians and quartiles.
MistakeMisleading charts.
InsteadChoose the right chart, label it and start bars at zero.
MistakeDashboards nobody uses.
InsteadKeep them simple and tied to decisions.
Summary and key terms
- Your own records combine platforms, history, attributes and revenue.
- A content log has one row per post with attributes and fixed-window results.
- Export platform data monthly and note definitions.
- Tidy data make analysis easy.
- Medians, quartiles, rates and growth formulas cover most needs.
- Pivot tables and clear charts reveal patterns.
- A simple dashboard and review routine turn data into decisions.
- Content log
- Spreadsheet with one row per piece of content.
- Attribute
- Characteristic you tag content with, such as topic.
- Export
- Downloading data from a platform.
- Tidy data
- One observation per row, one variable per column.
- Quartile
- Value dividing sorted data into quarters.
- Interquartile range
- Difference between the third and first quartiles.
- Pivot table
- Summary of data grouped by categories.
- Histogram
- Chart of a distribution.
- Dashboard
- Single view of key metrics.
- Review routine
- Regular schedule for analyzing data.
Practice problems
Work each problem on paper first, then reveal the answer to check.
Name two reasons to keep your own data.
Show answer
Cross-platform comparison, history, attributes, revenue links.
Why record results at fixed windows?
Show answer
For fair comparisons.
What is tidy data?
Show answer
One observation per row, one variable per column, one value per cell.
Formula for shares per 1,000 reach?
Show answer
=shares/reach*1000.
Median of 3, 5, 6, 9 thousand views?
Show answer
5,500.
What does a pivot table do?
Show answer
Summarizes data by category.
Which chart shows trends over time?
Show answer
A line chart.
Why does the mean sit above the median in social data?
Show answer
Outliers skew the distribution right.
Name a free dashboard tool.
Show answer
Looker Studio or spreadsheet charts.
What should a monthly review end with?
Show answer
Written decisions for the next month.
Lesson quiz · 5 questions
Score 60% or more to complete this lesson.
Create a free account to save your progress, take quizzes and earn a certificate.