
ITIL-110 · Lesson 10 of 12 · 30 min
Measuring value: KPIs, CSFs and OKRs
If value is perceived and co-created, how can anyone measure it? There is no single number for value, but organizations can measure the outcomes, costs, risks and experiences that make it up, and use those measures to make better decisions. This lesson introduces the basic vocabulary of measurement in service management: metrics, critical success factors (CSFs), key performance indicators (KPIs) and objectives and key results (OKRs). It explains the difference between leading and lagging measures, warns about common traps such as the "watermelon" service level agreement, and works through simple calculations. Later courses go deeper into measurement and reporting; this lesson gives the foundations.
Why measure?
Measurement supports four purposes:
- Validate: confirm that decisions and services are achieving what was intended.
- Direct: set targets and show people what matters.
- Justify: provide evidence for investment, change or continuation.
- Intervene: spot problems early and act before they grow.
Measurement is not free. Collecting, analyzing and reporting data takes effort, and every measure risks distorting behavior if people focus on the number instead of the purpose behind it. The aim is a small set of meaningful measures linked to value, not a dashboard of everything that can be counted.
Metrics, CSFs and KPIs
A metric is a measurement or calculation that is monitored or reported for management and improvement. Examples include the number of incidents per month, average response time and cost per transaction.
A critical success factor (CSF) is a necessary precondition for achieving intended results. It describes what must go right. For an online learning service, CSFs might be "learners can access courses whenever they need to" and "learners find the content useful".
A key performance indicator (KPI) is an important metric used to evaluate the success in meeting an objective, and is usually linked to a CSF. For the CSF "learners can access courses whenever they need to", a KPI could be "availability of at least 99.5 % during agreed hours". For "learners find the content useful", a KPI could be "average lesson rating of at least 4.2 out of 5".
| Objective | Critical success factor | KPI | Target |
|---|---|---|---|
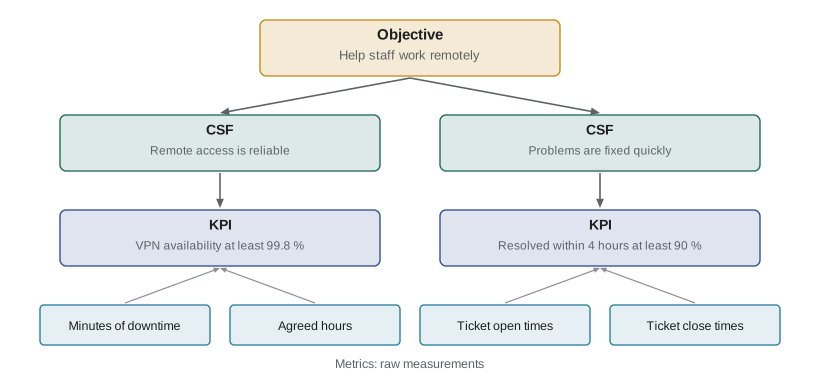
| Help staff work remotely | Remote access is reliable | VPN availability during business hours | ≥ 99.8 % |
| Help staff work remotely | Problems are fixed quickly | Remote-access incidents resolved within 4 hours | ≥ 90 % |
| Reduce cost of IT support | Users solve simple issues themselves | Share of password resets done through self-service | ≥ 80 % |
| Improve user experience | Interactions are easy | Customer effort score (1–7, higher is easier) | ≥ 5.5 |
Leading and lagging measures
Lagging measures report results after the fact: last quarter's availability, customer satisfaction, cost per user. Leading measures give early warning of future results: the number of unpatched servers, rising queue lengths at the service desk, a growing backlog of changes. A balanced set includes both. Lagging measures tell you whether you achieved your objectives; leading measures help you act in time.
| Area | Leading measure | Lagging measure |
|---|---|---|
| Availability | Percentage of critical components with redundancy tested this quarter | Monthly availability achieved |
| Security | Days to patch critical vulnerabilities | Number of security incidents |
| Experience | Average wait time on the support chat | Quarterly satisfaction score |
| Cost | Licenses assigned but unused | Annual cost per user |
Objectives and key results
Many organizations now use objectives and key results (OKRs) to set direction. An objective is a qualitative, inspiring statement of what you want to achieve. Key results are a few measurable results that show whether you achieved it. OKRs are usually set for a quarter or a year and reviewed often. They differ from KPIs in emphasis: KPIs monitor ongoing health; OKRs drive change toward a new level.
Worked problem
Scoring an OKR
Objective: "Make it effortless for new employees to get started." Key results for the quarter: (1) raise the share of new starters with working equipment on day one from 70 % to 95 % (achieved 90 %); (2) cut first-week support tickets per new starter from 3.0 to 1.0 (achieved 1.8); (3) raise new-starter satisfaction from 3.6 to 4.5 out of 5 (achieved 4.3). Score each key result from 0 to 1 by progress made, and give the average.
Show solution
- KR1 progress: (90 − 70) ÷ (95 − 70) = 20 ÷ 25 = 0.80.
- KR2 progress: (3.0 − 1.8) ÷ (3.0 − 1.0) = 1.2 ÷ 2.0 = 0.60.
- KR3 progress: (4.3 − 3.6) ÷ (4.5 − 3.6) = 0.7 ÷ 0.9 ≈ 0.78.
- Average: (0.80 + 0.60 + 0.78) ÷ 3 ≈ 0.73.
Answer: About 0.73 overall. Many organizations treat 0.6 to 0.7 on ambitious OKRs as a good result. The weakest area, first-week tickets, is where to focus next.
Service levels and the watermelon effect
Service level agreements (SLAs) record agreed targets for services, often for warranty measures such as availability and response times. A common problem is the watermelon SLA: green on the outside, red on the inside. Every target in the report is met, yet consumers are unhappy because the targets measure the wrong things, or measure them in a way that hides real problems. For example, an SLA may require incidents to be responded to within 15 minutes, which is met by sending an automatic acknowledgment, while the actual fix takes days.
To avoid watermelons, organizations:
- Link SLA targets to outcomes consumers care about, not only provider activity.
- Measure end to end, from the consumer's point of view, rather than component by component.
- Include experience measures alongside warranty measures. Some organizations use experience level agreements (XLAs) that set targets for experience, such as effort or sentiment.
- Review SLAs regularly with consumers, as part of relationship management.
Worked problem
Exposing a watermelon
An SLA requires 95 % of incidents to receive a first response within 30 minutes; the provider achieves 99 %. The same month, a survey finds only 55 % of users satisfied with incident handling, and data shows the average time to restore service was 3.2 business days. What is happening, and what KPI would be better?
Show solution
- The SLA measures first response, an output that can be met by an automated reply.
- Users care about getting back to work (the outcome), which took over three days on average.
- The SLA is green while experience is red: a watermelon.
- Better KPIs: percentage of incidents resolved within an agreed time by priority, and user satisfaction with incident handling.
Answer: The SLA tracks the wrong thing. Replace or supplement it with time-to-restore targets by priority and an experience measure.
Balancing measures
Measures can pull against each other. Pushing first-contact resolution up may lengthen call times. Cutting cost per ticket may reduce quality. A balanced set of measures across outcomes, costs, risks and experience helps prevent one improvement causing harm elsewhere. A simple weighted score can combine several KPIs into an overall view, as long as the underlying measures remain visible.
Worked problem
A weighted service scorecard
A service desk uses four KPIs, each scored as percentage of target achieved (capped at 100): resolution within target 92 % (weight 40 %), satisfaction 80 % (weight 30 %), cost per ticket 100 % (weight 20 %), knowledge articles used 60 % (weight 10 %). Calculate the weighted score.
Show solution
- Resolution: 92 × 0.40 = 36.8.
- Satisfaction: 80 × 0.30 = 24.0.
- Cost: 100 × 0.20 = 20.0.
- Knowledge: 60 × 0.10 = 6.0.
- Total: 36.8 + 24.0 + 20.0 + 6.0 = 86.8.
Answer: A weighted score of about 87 out of 100. Keep each KPI visible; the total hides that knowledge use is well below target.
A well-known warning, often called Goodhart's law, says that when a measure becomes a target, it ceases to be a good measure. If agents are rewarded only for closing tickets quickly, some will close tickets before the problem is solved. Pair targets with checks on quality, and talk about the purpose behind each measure.
Reporting measures well
Measures only create value when people use them to decide something. Good reports are short, focused on the audience and tell a story: what happened, why it matters and what will be done. A service owner's monthly report to a customer might show three or four KPIs against targets, a trend over the last six months, a note on any target missed with its cause and fix, and one or two improvement actions. Long tables of numbers without interpretation are rarely read.
Trends are often more informative than single values. A satisfaction score of 82 % means little on its own; 82 % after six months of decline from 90 % tells a different story from 82 % after rising from 70 %. Showing targets, trends and short explanations together helps readers see whether action is needed.
| Audience | What they need from a report | Typical frequency |
|---|---|---|
| Service team | Detailed operational metrics to manage daily work | Daily or weekly |
| Customer and service owner | KPIs against targets, trends, issues and actions | Monthly |
| Senior leaders and sponsors | Outcomes, costs, risks and progress on objectives | Quarterly |
Worked problem
First-contact resolution
In a month the service desk receives 3,200 contacts. 2,240 are resolved during the first contact without escalation or call-back. Last month the rate was 65 %. What is this month's first-contact resolution rate and the change in percentage points?
Show solution
- Rate: 2,240 ÷ 3,200 = 0.70, or 70 %.
- Change: 70 − 65 = 5 percentage points.
- Relative improvement: 5 ÷ 65 ≈ 7.7 %.
Answer: First-contact resolution rose to 70 %, up 5 percentage points. Check alongside it that satisfaction and reopened tickets did not worsen, so the gain is real.
Be careful to distinguish percentage points from percentages. A rise from 65 % to 70 % is 5 percentage points, but a 7.7 % relative increase. Reports that mix the two can mislead.
Finally, measurement should evolve. As services and objectives change, some measures stop being useful and new ones are needed. Reviewing the set of KPIs with consumers at least once a year, removing measures nobody uses and adding measures for new outcomes, keeps measurement focused on value rather than habit. A short list that people discuss and act on is worth far more than a long list that is collected and ignored. When a measure is retired, record why, so that the reasoning is not lost when people change roles.
It is also worth checking how each measure is calculated. Two teams can report the same KPI name, such as resolution time, using different start and stop points or excluding different cases. Agreeing clear definitions, writing them down and applying them consistently over time makes comparisons meaningful and prevents arguments about whose numbers are right. A short definition sheet for each KPI, stating its purpose, formula, data source and owner, is a simple way to do this.
Common mistakes
MistakeCalling every metric a KPI.
InsteadReserve KPI for important metrics linked to objectives and CSFs.
MistakeMeasuring only lagging results.
InsteadAdd leading measures that give early warning.
MistakeCelebrating a fully green SLA report while users complain.
InsteadCheck for the watermelon effect and measure outcomes and experience.
MistakeRewarding a single number.
InsteadUse a balanced set and watch for gaming.
MistakeTreating OKRs and KPIs as the same.
InsteadUse KPIs to monitor health and OKRs to drive change.
Summary and key terms
- Measurement helps validate, direct, justify and intervene.
- A metric is a measurement or calculation monitored for management and improvement.
- A critical success factor is a necessary precondition for achieving intended results.
- A KPI is an important metric used to evaluate success in meeting an objective.
- Balance leading and lagging measures.
- OKRs set an inspiring objective with a few measurable key results.
- Avoid watermelon SLAs by measuring outcomes and experience end to end.
- Metric
- A measurement or calculation that is monitored or reported for management and improvement.
- Critical success factor (CSF)
- A necessary precondition for the achievement of intended results.
- Key performance indicator (KPI)
- An important metric used to evaluate the success in meeting an objective.
- Leading measure
- A measure that gives early warning of future results.
- Lagging measure
- A measure that reports results after they occur.
- OKR
- Objectives and key results: a qualitative objective with measurable key results.
- Service level agreement (SLA)
- A documented agreement between a provider and a customer that identifies services required and the expected level of service.
- Watermelon SLA
- An SLA report that is green while consumers are dissatisfied.
- XLA
- Experience level agreement: targets based on consumer experience.
- Goodhart's law
- When a measure becomes a target, it ceases to be a good measure.
Practice problems
Work each problem on paper first, then reveal the answer to check.
Name the four purposes of measurement.
Show answer
Validate, direct, justify and intervene.
What is a CSF?
Show answer
A necessary precondition for achieving intended results.
Is "unpatched servers this week" leading or lagging?
Show answer
Leading.
Progress from 50 % toward a target of 90 % when 74 % is achieved?
Show answer
24 ÷ 40 = 0.6.
What is a watermelon SLA?
Show answer
One that looks green while consumers are unhappy.
Weighted score: 90 × 0.5 + 70 × 0.5?
Show answer
45 + 35 = 80.
What do XLAs set targets for?
Show answer
Experience.
State Goodhart's law.
Show answer
When a measure becomes a target, it ceases to be a good measure.
How do OKRs differ from KPIs?
Show answer
OKRs drive change toward a new level; KPIs monitor ongoing health.
Why measure end to end?
Show answer
Component measures can hide what consumers actually experience.
Lesson quiz · 5 questions
Score 60% or more to complete this lesson.
Create a free account to save your progress, take quizzes and earn a certificate.