
ITIL-110 · Lesson 9 of 12 · 30 min
Experience: customer and user journeys and touchpoints
Two services can facilitate exactly the same outcome at the same cost and risk, yet one is loved and the other resented. The difference is experience. ITIL 4 introduced customer experience, user experience and customer journeys as important ideas, and ITIL (Version 5) raises experience to a key term alongside utility, warranty and value. This lesson explains what experience means, how journeys and touchpoints help providers understand it, how to measure it with common scores such as CSAT, CES and NPS, and how accessibility and inclusion shape good experience.
What experience means
Experience is the sum of what people encounter, do, think and feel when they interact with a product, a service or an organization. It includes functional aspects (could I do what I needed?), practical aspects (was it easy and quick?) and emotional aspects (did I feel respected, confident, frustrated?). Experience is perceived, like value, and it shapes perceived value directly. A clumsy, confusing service lowers perceived value even when it eventually works.
ITIL distinguishes customer experience (CX), which covers all interactions between a customer and a provider across the whole relationship, from user experience (UX), which focuses on the interactions of users with a particular product or interface. In practice the two overlap, and many organizations talk simply about service experience. What matters is to see experience as something designed and managed, not left to chance.
| Aspect | Question the person asks | Example in a parking permit service |
|---|---|---|
| Functional | Could I achieve what I needed? | I got a valid residential permit |
| Practical | How much effort did it take? | Ten minutes online, no office visit |
| Emotional | How did it make me feel? | Confident, because I received clear confirmation immediately |
Journeys and touchpoints
A customer journey is the complete end-to-end experience a customer has with one or more providers and their products, through the touchpoints and service interactions supported by those products. A touchpoint is any event where a consumer or potential consumer has an encounter with the provider or its products and resources. Touchpoints include a website visit, an email, a phone call, an app notification, an invoice, a technician's visit and even an advertisement.
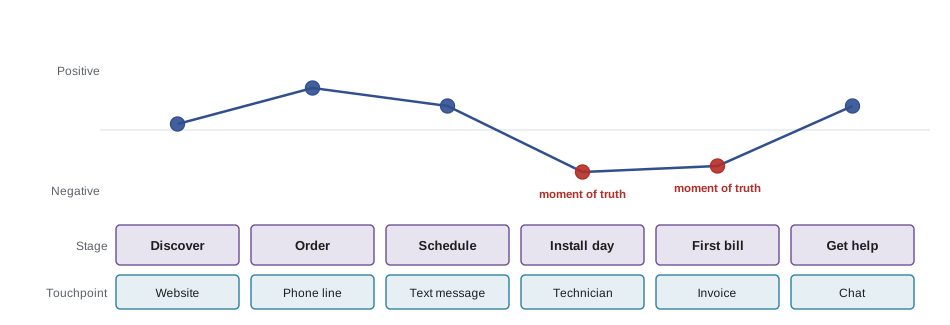
Not every touchpoint involves direct interaction. Seeing a news story about the provider's outage is a touchpoint that shapes perception. Some touchpoints are moments of truth: points where the consumer forms a strong impression that colors the whole relationship. The first day using a new service, the handling of a serious incident and the experience of canceling are typical moments of truth.
Mapping a journey
Journey mapping is a practical technique for understanding experience. A team chooses a persona (a realistic description of a type of consumer) and a scenario, then lays out the stages the persona goes through, the touchpoints at each stage, what the persona is doing, thinking and feeling, and where problems occur. Good journey maps are built from evidence: interviews, observation, support tickets, survey comments and analytics, not just the team's assumptions.
- Choose a persona and scenario, such as "new employee getting set up in the first week".
- List the stages from the persona's point of view, not the provider's internal processes.
- Add touchpoints, actions, thoughts and emotions at each stage.
- Mark pain points and moments of truth.
- Identify which teams, systems and suppliers sit behind each touchpoint.
- Choose improvements and measure their effect.
Worked problem
Finding the pain points
A university IT team maps the journey of a new international student getting connected. Stages: receive welcome email, activate account, set up multi-factor authentication (MFA), connect to campus Wi-Fi, access the learning system. Support data shows 40 % of all first-week tickets relate to MFA setup, mostly because students' home phone numbers cannot receive text codes. What would you recommend?
Show solution
- The pain point is MFA setup, a moment of truth in the student's first week.
- The cause is a design assumption that every student has a local phone number for text messages.
- Offer an authenticator app option with clear instructions before arrival, plus printed backup codes at orientation.
- Update the welcome email to explain the steps in plain language, in several languages.
- Measure the change in MFA-related tickets and student satisfaction.
Answer: Redesign MFA setup around international students' situation, using an app-based method and pre-arrival guidance, then track ticket volume and satisfaction to confirm the improvement.
Measuring experience
Experience can be measured in several ways. Three common survey-based scores are customer satisfaction (CSAT), customer effort score (CES) and net promoter score (NPS). Each answers a different question, and none is enough alone.
| Measure | Typical question | How it is scored |
|---|---|---|
| CSAT | How satisfied were you with this interaction? (1–5) | Percentage of respondents choosing 4 or 5 |
| CES | How easy was it to get what you needed? (1–7) | Average score, or percentage finding it easy |
| NPS | How likely are you to recommend us? (0–10) | % promoters (9–10) minus % detractors (0–6) |
Worked problem
Calculating CSAT and NPS
After a service desk interaction, 200 users answered a CSAT question (1–5): 30 chose 1 or 2, 30 chose 3, 90 chose 4 and 50 chose 5. The same 200 answered an NPS question: 60 scored 9–10, 80 scored 7–8 and 60 scored 0–6. Calculate CSAT and NPS.
Show solution
- CSAT = (90 + 50) ÷ 200 = 140 ÷ 200 = 70 %.
- Promoters = 60 ÷ 200 = 30 %.
- Detractors = 60 ÷ 200 = 30 %.
- NPS = 30 − 30 = 0.
Answer: CSAT is 70 % and NPS is 0. Users were mostly satisfied with the interaction but no more likely to recommend than to criticize the service overall, which suggests looking beyond individual interactions to the wider experience.
Survey scores have limits. Response rates are often low, and those who respond may not represent everyone. Scores tell you that something is wrong but not why. Combine them with operational data (wait times, repeat contacts, abandonment rates), comments, observation and journey mapping to build a full picture.
Worked problem
Using operational data
An online form for business license renewals is started by 5,000 people a month and completed by 3,400. Of those who abandon, analytics show that 70 % leave on the page asking for a document upload. How many people abandon at that page each month, and what does this suggest?
Show solution
- Abandonments: 5,000 − 3,400 = 1,600 a month.
- Completion rate: 3,400 ÷ 5,000 = 68 %.
- At the upload page: 0.70 × 1,600 = 1,120 people a month.
Answer: About 1,120 people a month abandon at the document upload page. That page is the main pain point; investigate file size limits, unclear instructions or whether the document is really needed.
Accessibility and inclusion
A service that some people cannot use at all fails on experience for them, however good it is for others. Accessible design ensures that people with disabilities, older adults, people with limited literacy, people using assistive technologies and people with slow connections can use the service. Inclusive design goes further, considering language, culture, age, income and context from the start.
In the US, the Americans with Disabilities Act (ADA) applies to many public and private services, and Section 508 of the Rehabilitation Act requires federal agencies to make their information and communication technology accessible. In 2024 the Department of Justice adopted a rule requiring state and local government websites and apps to meet the international Web Content Accessibility Guidelines (WCAG) 2.1 level AA, with compliance dates phased by government size. Service providers should check which rules apply to them and design to WCAG as a practical baseline.
- Use plain language and clear structure.
- Ensure all functions can be used with a keyboard and screen reader.
- Provide text alternatives for images and captions for video.
- Offer more than one channel, such as phone or in-person help, for people who cannot use digital channels.
- Test with real users who have diverse needs, not only with automated tools.
Designing for good experience
Several principles help providers design better experiences:
- Start from the consumer's goal, not the provider's structure. Users should not need to know which department handles what.
- Reduce effort: ask for information once, pre-fill what you already know, avoid unnecessary steps.
- Be consistent across channels, so starting online and finishing by phone does not mean starting again.
- Communicate proactively, especially when things go wrong. A text message saying the technician will be 30 minutes late turns a moment of frustration into one of trust.
- Close the loop: tell consumers what changed because of their feedback.
Experience inside the organization
Experience matters for internal services too. Employee experience, the way staff experience the tools, services and processes their employer provides, has a large effect on productivity and retention. A new employee who waits a week for a laptop, cannot find how to request software and gets five different answers from five teams forms an impression of the whole organization. Many internal providers now map employee journeys, such as joining, changing roles and leaving, in the same way that external providers map customer journeys.
Internal experience is also linked to external experience. Front-line staff struggling with slow, confusing systems pass that frustration on to customers through longer waits and more errors. Improving the tools that service desk agents, nurses or bank tellers use often improves the experience of the people they serve. Some organizations measure this directly with surveys of staff about their tools, alongside customer measures.
Worked problem
Customer effort score
After using a new self-service portal, 250 staff rate "It was easy to get what I needed" from 1 (strongly disagree) to 7 (strongly agree). Responses: 20 chose 1–2, 30 chose 3, 40 chose 4, 90 chose 5–6 and 70 chose 7. What share found it easy (5 to 7), and what share found it hard (1 to 3)?
Show solution
- Easy: 90 + 70 = 160; 160 ÷ 250 = 64 %.
- Hard: 20 + 30 = 50; 50 ÷ 250 = 20 %.
- Neutral: 40 ÷ 250 = 16 %.
Answer: 64 % found the portal easy and 20 % found it hard. The comments from the hard group are the best source of improvement ideas.
Experience work is never finished. Consumer expectations keep rising as people use better services elsewhere, so a journey that felt smooth two years ago may now feel slow. Revisiting key journeys regularly, and listening to front-line staff who hear consumers' frustrations first, keeps a provider's understanding of experience current.
Small improvements at moments of truth, such as a clear confirmation message or a friendly call-back after a problem, often change perceptions more than large investments elsewhere.
Common mistakes
MistakeThinking experience only matters for external customers.
InsteadDesign and measure the experience of internal users too.
MistakeMapping journeys from internal process charts.
InsteadBuild journey maps from the consumer's point of view using evidence.
MistakeRelying on one survey score.
InsteadCombine CSAT, CES, NPS, operational data and comments.
MistakeCalculating NPS as the average of 0–10 scores.
InsteadSubtract the percentage of detractors (0–6) from promoters (9–10).
MistakeTreating accessibility as an add-on at the end.
InsteadDesign for accessibility and inclusion from the start.
Summary and key terms
- Experience is what people encounter, do, think and feel when interacting with a provider and its services.
- ITIL (Version 5) treats experience as a key term alongside utility, warranty and value.
- A customer journey is the end-to-end experience across touchpoints and service interactions.
- A touchpoint is any encounter between a consumer and a provider or its resources.
- Journey mapping uses evidence to find pain points and moments of truth.
- CSAT, CES and NPS measure different things; combine them with operational data.
- Accessible and inclusive design is essential to good experience and often required by law.
- Experience
- What people encounter, do, think and feel when interacting with products, services and providers.
- Customer experience (CX)
- The sum of functional and emotional interactions with a provider across the relationship.
- User experience (UX)
- The experience of users interacting with a particular product or interface.
- Customer journey
- The complete end-to-end experience customers have with one or more providers through touchpoints and service interactions.
- Touchpoint
- Any event where a consumer or potential consumer encounters the provider or its products and resources.
- Moment of truth
- A touchpoint where the consumer forms a strong lasting impression.
- Persona
- A realistic description of a type of consumer used in design.
- CSAT
- Customer satisfaction score, usually the share of satisfied responses.
- NPS
- Net promoter score: percentage of promoters minus percentage of detractors.
- WCAG
- Web Content Accessibility Guidelines, the international baseline for accessible digital services.
Practice problems
Work each problem on paper first, then reveal the answer to check.
Name the three aspects of experience described in this lesson.
Show answer
Functional, practical and emotional.
Define a touchpoint.
Show answer
Any event where a consumer encounters the provider or its products and resources.
Give an example of a moment of truth.
Show answer
For example handling a serious incident or canceling a service.
CSAT when 120 of 150 respondents choose 4 or 5?
Show answer
80 %.
NPS with 45 % promoters and 20 % detractors?
Show answer
25.
Which NPS scores count as detractors?
Show answer
0 to 6.
Completion rate when 1,800 of 2,400 finish a form?
Show answer
75 %.
Why combine survey scores with operational data?
Show answer
Scores show something is wrong; data and comments help show why.
What is a persona?
Show answer
A realistic description of a type of consumer.
Name one accessible design practice.
Show answer
For example captions for video or keyboard-accessible functions.
Lesson quiz · 5 questions
Score 60% or more to complete this lesson.
Create a free account to save your progress, take quizzes and earn a certificate.