
ROB-360 · Lesson 12 of 12 · 31 min
Capstone: the software and simulation pipeline for a delivery robot
This capstone brings the course together in one design. You are the software lead for a small indoor delivery robot that carries medication and supplies between a hospital pharmacy and nursing stations on four floors, using elevators. The hardware exists; the team of eight engineers must now build software that is reliable, testable, safe and maintainable, and a pipeline that takes every change from a developer's laptop to a fleet of 30 robots in three hospitals. The lesson works through the decisions in order: requirements and operational design domain, architecture, the test strategy, the simulation plan, continuous integration and delivery, operations and security, and the metrics that will show whether the system works. Every number is illustrative, but the reasoning is the point.
Step 1: requirements and operational design domain
The operational design domain is hospital corridors with polished vinyl floors, widths from 1.6 m to 3.0 m, slopes under 1:12, doors with automatic openers, elevators controlled through a building integration interface, lighting from 50 to 800 lux, and people of all kinds: staff in a hurry, patients with walkers and wheelchairs, visitors and children. Network coverage is Wi-Fi with known dead zones in elevators and stairwells. Outside this domain, for example on wet floors flagged by cleaning staff or during a fire alarm, the robot must stop safely or return to a holding area.
Key requirements, written in the style of lesson 2, include: 'The robot shall complete deliveries within 15 minutes for at least 95 % of missions under nominal traffic'; 'When a person is detected within the protective field, the robot shall stop within 0.4 m from speeds up to 1.0 m/s'; 'The robot shall not enter an elevator car that already contains a bed or wheelchair'; 'While network connectivity is lost, the robot shall continue its current mission using on-board data and report on reconnection'; 'The compartment shall unlock only for an authenticated recipient badge'; and quality requirements on availability (99 % during scheduled hours), mean time between interventions (at least 20 hours) and update windows (only while docked).
Worked problem
Checking the stop requirement against the hardware
The robot's protective sensor and safety controller react in 80 ms in the worst case, the drive brakes at 1.8 m/s², and software adds up to 50 ms before the safety controller is triggered by perception (the safety scanner path bypasses software). From 1.0 m/s, does the scanner path meet the 0.4 m stop requirement, and does the perception path?
Show solution
- Scanner path: reaction distance \( 1.0 \times 0.08 = 0.08 \) m; braking \( 1.0^2 / (2 \times 1.8) \approx 0.28 \) m; total about 0.36 m, which meets 0.4 m.
- Perception path: reaction \( 1.0 \times (0.08 + 0.05) = 0.13 \) m plus 0.28 m braking gives about 0.41 m, slightly over.
- Decision: the safety requirement is met by the certified scanner path; perception is used for earlier slowdowns, not as the safety function.
Answer: The scanner path stops in about 0.36 m and meets the requirement; the perception path would not, which confirms the architectural choice to keep safety in the independent scanner and safety controller.
Step 2: architecture
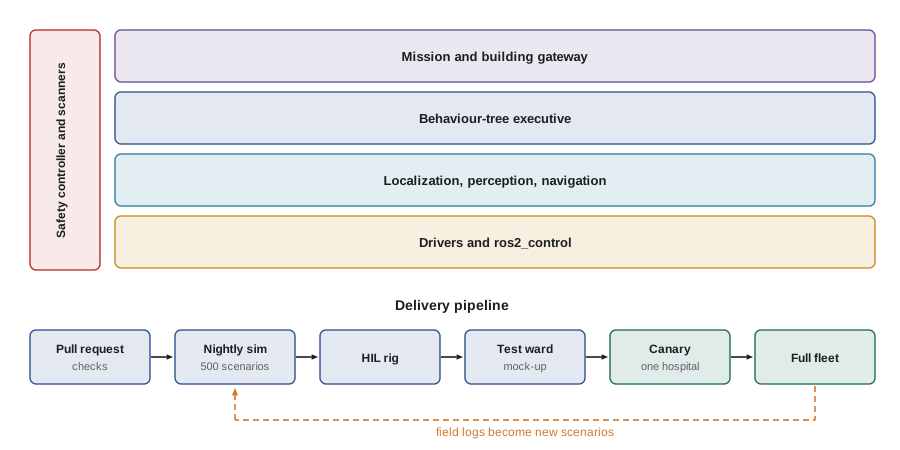
The architecture follows lesson 1. A certified safety controller with two safety laser scanners enforces protective fields and speed limits independently of the main computer. The main computer runs ROS 2 on an LTS distribution: drivers and ros2_control at the bottom; localization, perception and Nav2 navigation in the functional layer; a behavior-tree executive handling missions, doors, elevators and failures; and a mission gateway that talks to the hospital's fleet server and elevator system through authenticated APIs. High-bandwidth perception nodes are composed in one container process; the executive, gateway and diagnostics run in separate processes so they can be restarted independently. Every architectural decision of consequence, such as the choice of localization approach or behavior trees over state machines, is captured in an ADR.
# Rough compute budget on the main computer (8 cores); values illustrative
nodes = {"lidar+scanner drivers": 0.3, "camera drivers": 0.4, "localization": 0.8,
         "people detection (GPU-assisted)": 1.2, "costmaps": 0.7, "planner+controller": 0.9,
         "BT executive": 0.2, "diagnostics+logging": 0.4, "gateway": 0.2,
         "rosbag2 recording": 0.5}
total = sum(nodes.values())
print(f"total {total:.1f} cores of 8 -> utilization {total / 8:.0%}")
peak = total * 1.5                      # bursts when replanning in crowds
print(f"peak estimate {peak:.1f} cores -> {'OK' if peak <= 8 * 0.8 else 'over 80 % budget'}")total 5.6 cores of 8 -> utilization 70% peak estimate 8.4 cores -> over 80 % budget
The average load of about 70 % looks comfortable, but the peak estimate of 8.4 cores exceeds both the 80 % budget and the machine itself. The budget forces a design change before any code is written: the team moves people detection entirely onto the GPU, lowers the global costmap update rate from 5 Hz to 2 Hz, and records compressed rather than raw camera topics, bringing the estimated peak under 6.4 cores. A budget like this is revisited with measured figures once the software runs, using the tracing tools of lesson 9.
Step 3: test strategy
The test strategy follows the pyramid of lesson 4. Algorithm code in every package is separated from the ROS 2 wrappers and covered by unit and property-based tests: geometry utilities, costmap layers, the elevator state machine, the compartment authentication logic. Integration tests use launch_testing with mock hardware through ros2_control and a library of golden rosbag2 recordings from the hospitals: crowded corridors at shift change, glare from windows, glass doors, elevator lobbies. System tests run the full stack in simulation, described in step 4, and on a hardware-in-the-loop rig with the real main computer and safety controller. Acceptance tests on a mock-up ward and then on site follow the customer's criteria.
| Level | Count | Runs | Gate |
|---|---|---|---|
| Unit and property tests | About 2500 | Every pull request, about 3 minutes sharded | Merge |
| Integration and replay tests | About 250 | Every pull request, about 8 minutes sharded | Merge |
| Simulation scenarios | 500 | Nightly and for release candidates | Release |
| Hardware-in-the-loop | 40 scripted tests | Release candidates and safety-relevant changes | Release |
| Mock-up ward trials | 100 missions | Release candidates | Release |
| Canary fleet | 3 robots, 1 week | Each release | Fleet rollout |
Worked problem
Is 100 mock-up missions enough?
The release criterion requires showing that the mission failure rate is below 2 %. If all 100 mock-up missions succeed, what does that support, and what role does simulation play?
Show solution
- Zero failures in 100 trials supports a failure rate below about \( 3/100 = 3 \) % at 95 % confidence (lesson 2).
- That alone does not show 2 %; about 150 failure-free trials would.
- The 500 nightly simulation scenarios, run over several nights with randomization, provide thousands of missions, and the reality gap for mission success has been measured (lesson 8), so the real trials confirm the simulation's fidelity rather than carry the whole argument.
Answer: One hundred real missions support only about 3 %. The release case combines validated simulation volume with the real trials, and the canary week adds real evidence before full rollout.
Step 4: the simulation plan
The team uses Gazebo with ros2_control so the same controllers run in simulation and on the robot. The robot model is generated from one Xacro source with CAD-derived inertias and identified drive dynamics (lesson 8): a time constant of about 0.16 s and floor friction measured on hospital vinyl, both randomized within their measured spread. Sensor models include measured lidar noise, dropouts on dark and glossy surfaces, camera latency of 40 to 90 ms and Wi-Fi outages in elevators. Worlds are built from the three hospitals' floor plans, with doors, elevator lobbies and furniture; scenarios come straight from the use cases and exception flows: blocked corridor, crowd at shift change, elevator full, door fails to open, network lost, battery low mid-mission.
import random
rnd = random.Random(12)
# Nightly scenario mix and expected run time
scenarios = {"nominal route": 200, "crowd at shift change": 80, "blocked corridor": 60,
             "elevator full or slow": 60, "door fault": 40, "network outage": 30,
             "low battery mid-mission": 30}
minutes = {k: rnd.uniform(5, 9) for k in scenarios}          # simulated minutes per run
total_sim = sum(n * minutes[k] for k, n in scenarios.items())
rtf, machines = 2.5, 10
print(f"runs: {sum(scenarios.values())}, simulated time {total_sim / 60:.0f} h")
print(f"wall-clock on {machines} machines at RTF {rtf}: {total_sim / rtf / machines / 60:.1f} h")runs: 500, simulated time 56 h wall-clock on 10 machines at RTF 2.5: 2.2 h
Simulation results are judged by statistics, not single runs: success rate, collisions (which must be zero), near misses below 0.3 m, mission time distribution and interventions per hundred missions. Every month the team repeats matched experiments on the mock-up ward to check that the reality gap for these metrics stays within agreed thresholds.
Step 5: continuous integration and delivery
Every pull request runs in a pinned ROS 2 container image: formatting, ament linters, clang-tidy, type checks, unit and integration tests with sanitizers on a subset, all within about 12 minutes thanks to ccache and sharding (lesson 7). Merges require passing checks and review, with CODEOWNERS routing safety-relevant changes to the safety lead and requiring a second reviewer. Nightly jobs run the simulation suite and publish a dashboard. Release candidates are tagged with semantic versions, built into signed runtime images referenced by digest, accompanied by an SBOM and a changelog, and promoted through hardware-in-the-loop tests, the mock-up ward and a canary group of three robots in one hospital for a week, with automatic rollback if mission success or intervention rates degrade.
Worked problem
Release cadence
Each release takes 1 day for HIL and mock-up trials, 7 days of canary operation, and 2 days for staged rollout to all three hospitals. Hotfixes for safety-relevant defects skip the canary week but not HIL. How many regular releases fit in a year with a one-week buffer between releases, and how fast can a hotfix ship?
Show solution
- Regular release cycle: \( 1 + 7 + 2 = 10 \) days, plus 7 days buffer: 17 days.
- Releases per year: \( 365 / 17 \approx 21 \), so roughly every two and a half weeks.
- Hotfix: 1 day of HIL plus 2 days of staged rollout: about 3 days.
Answer: About 21 regular releases a year, and safety hotfixes in about 3 days. A predictable cadence lets the hospitals plan, while the hotfix path keeps risk low when something urgent appears.
Step 6: operations and security
Each robot logs structured events, publishes ROS 2 diagnostics with stale detection, records low-rate topics continuously and snapshots sensor data around emergency stops, near misses and operator reports, uploading them overnight (lesson 9). A buffering gateway sends metrics and alerts to the fleet back end; alerts page on-call staff only for stuck robots, safety events and site-wide drops in success, each with a runbook. Updates install only when docked, with A/B partitions and health checks. Security follows lesson 10: a STRIDE threat model of the robot, fleet server, elevator interface and nurse tablets; SROS2 enforcing who may command the base and unlock the compartment; secure boot and signed images; outbound-only encrypted tunnels; unique device certificates with automated rotation and a recovery procedure; least-privilege services; SBOM scanning on every build; and a privacy design that blurs faces in uploaded snapshots and keeps raw camera data on the robot for only 72 hours, consistent with the hospital's privacy obligations.
For the US hospitals, the privacy design is reviewed against HIPAA, since camera snapshots and delivery records can contain protected health information, and the company signs business associate agreements with the hospitals before deployment. FDA rules are checked to confirm the robot carries medication as a logistics device rather than performing a medical function.
Step 7: metrics and continuous improvement
The team agrees in advance how success will be measured: deliveries completed without help, mean time between interventions, availability, mission time percentiles, safety events (emergency stops, near misses) per thousand kilometers, escaped defects per release, CI lead time from commit to merge and from merge to fleet, and the flake rate of the test suite. Every intervention and safety event is reviewed; recurring causes get engineering fixes, and the logs are turned into new simulation scenarios or golden bags, so the test suite grows with experience. This loop, from field to test to fix to field, is the heart of robot software engineering.
# Interventions from the first three months, by cause (counts illustrative)
interventions = {"elevator integration timeout": 41, "blocked corridor > 5 min": 27,
                 "localization lost near glass doors": 18, "compartment badge read failure": 9,
                 "network gateway restart": 6, "other": 11}
hours = 30 * 3 * 30 * 16            # 30 robots, 3 months of 30 days, 16 h per day
total = sum(interventions.values())
print(f"interventions: {total}, mean time between interventions {hours / total:.0f} h")
running = 0
for cause, n in sorted(interventions.items(), key=lambda kv: -kv[1]):
    running += n
print(f"{cause:38} {n:3d} cumulative {running / total:5.1%}")interventions: 112, mean time between interventions 386 h elevator integration timeout 41 cumulative 36.6% blocked corridor > 5 min 27 cumulative 60.7% localization lost near glass doors 18 cumulative 76.8% other 11 cumulative 86.6% compartment badge read failure 9 cumulative 94.6% network gateway restart 6 cumulative 100.0%
The Pareto ordering directs effort. The mean time between interventions already exceeds the 20-hour requirement, but the elevator integration timeouts and blocked corridors account for over half of all interventions; fixing the elevator handshake (perhaps with retries and a clearer timeout policy, tested against recorded elevator logs) and adding a reroute behavior for long blockages would roughly halve the intervention rate. Each fix goes through the full pipeline, and each cause gets new regression scenarios so it cannot quietly return.
Common mistakes
MistakeStarting the pipeline design before agreeing requirements and the operational design domain
InsteadWrite the ODD and key requirements first; they define tests and metrics.
MistakeRelying on perception software for the safety stop
InsteadKeep the safety function in certified, independent hardware and use perception for earlier slowdowns.
MistakeClaiming release readiness from a small number of real trials alone
InsteadCombine validated simulation volume with real trials and a canary period.
MistakeTreating security and privacy as a final checklist
InsteadThreat-model and design privacy in from the start, with legal requirements for each country.
MistakeFixing field issues without adding regression tests
InsteadTurn every significant field failure into a simulation scenario or replay test.
Summary and key terms
- The capstone starts from an operational design domain and measurable requirements, checked early against the hardware.
- The architecture keeps safety independent, layers the ROS 2 software and composes high-bandwidth pipelines.
- The test plan follows the pyramid from unit and property tests through replay, simulation, HIL, mock-up and canary stages.
- The simulation uses identified dynamics, measured sensor models, randomization and scenarios from use cases, judged statistically.
- CI gates merges in about 12 minutes; releases are signed, versioned, documented with an SBOM and rolled out in stages.
- Operations and security combine diagnostics, snapshots, actionable alerts, safe updates, SROS2, secure boot and privacy by design.
- Agreed metrics and a Pareto view of interventions drive continuous improvement, with field failures feeding new tests.
- Capstone
- A culminating project that applies the whole course to one design.
- Protective field
- The area monitored by a safety scanner in which detection triggers a stop.
- Release criterion
- A measurable condition that must be met before a release proceeds.
- Mock-up
- A physical test environment built to resemble the deployment site.
- Release cadence
- The regular rhythm at which new releases are delivered.
- Hotfix
- An urgent release that fixes a specific serious defect through a shortened, controlled path.
- Compute budget
- An allocation of processor capacity to software components with a safety margin.
- Pareto analysis
- Ordering causes by frequency to find the few that account for most problems.
- Mean time between interventions
- Average operating time between events needing human help.
- Privacy impact assessment
- A structured review of how a system collects, uses and protects personal information.
Practice problems
Work each problem on paper first, then reveal the answer to check.
What is the first artifact to agree in the capstone?
Show answer
The operational design domain and key requirements.
From 0.8 m/s with 80 ms reaction and 1.8 m/s² braking, what is the stopping distance?
Show answer
About 0.24 m (0.064 m reaction plus 0.18 m braking).
Why is perception not used as the safety stop?
Show answer
Its latency is longer and it is not a certified independent safety function.
Which nodes are composed into one process in the capstone?
Show answer
The high-bandwidth perception nodes.
How many failure-free real missions support a failure rate below 2 %?
Show answer
About 150.
Where do simulation scenarios come from?
Show answer
From use cases, exception flows and field logs.
How long does a pull request take to pass CI in the capstone?
Show answer
About 12 minutes.
What protects the compartment unlock command?
Show answer
SROS2 access control and badge authentication.
What does a Pareto chart of interventions show?
Show answer
The few causes that account for most interventions.
What happens to each fixed field issue?
Show answer
It gets new regression scenarios or replay tests.
Lesson quiz · 5 questions
Score 60% or more to complete this lesson.
Create a free account to save your progress, take quizzes and earn a certificate.