
ROB-360 · Lesson 9 of 12 · 29 min
Logging, monitoring and fleet operations
A robot that works in the lab must also keep working in a customer's building at three in the morning with nobody watching. When something goes wrong, and it will, the team must be able to find out what happened from a distance, decide whether other robots are at risk and fix it without flying an engineer out. This lesson covers the operational side of robot software: structured logging, recording data with rosbag2, diagnostics, telemetry and observability, fleet monitoring and alerting, over-the-air updates, remote support and the reliability metrics that tie them together.
Logging that helps
Logs are the robot's diary. Good logs answer 'what was the robot doing, what did it believe and why did it act?' Every log line should carry a precise timestamp (with a synchronized clock, ideally PTP or NTP as in ROB-320), a severity level (DEBUG, INFO, WARN, ERROR, FATAL in ROS 2), the source node and enough context to be understood alone: identifiers of the mission, the goal and the robot. Structured logging, which writes key-value records such as JSON instead of free text, makes logs machine-searchable, so a fleet-wide query such as 'all localization resets in the last week with covariance above 0.5' takes seconds.
Logging also has costs. Excessive logging fills disks, consumes CPU and can block real-time threads, so high-rate events should be counted or sampled rather than logged individually, and logging from control loops should be throttled (ROS 2 offers throttled and once-only logging macros) or deferred to a non-real-time thread. Logs must also respect privacy: robots in homes, hospitals and stores may capture people, so camera images, names and locations need retention limits, access control and, where possible, anonymization, in line with the privacy laws discussed in lesson 10 and in the CISSP and robot vision courses.
import json, collections
# Structured log records from three robots (one JSON object per line)
lines = """{"t": 1000.2, "robot": "r07", "node": "nav", "level": "WARN", "event": "replan", "reason": "blocked"}
{"t": 1003.9, "robot": "r07", "node": "loc", "level": "ERROR", "event": "loc_reset", "cov": 0.71}
{"t": 1010.5, "robot": "r12", "node": "nav", "level": "INFO", "event": "goal_reached", "mission": "m881"}
{"t": 1011.0, "robot": "r07", "node": "loc", "level": "ERROR", "event": "loc_reset", "cov": 0.66}
{"t": 1019.4, "robot": "r03", "node": "dock", "level": "WARN", "event": "dock_retry", "attempt": 2}
{"t": 1022.8, "robot": "r07", "node": "loc", "level": "ERROR", "event": "loc_reset", "cov": 0.58}
{"t": 1030.1, "robot": "r12", "node": "nav", "level": "WARN", "event": "replan", "reason": "person"}""".splitlines()
recs = [json.loads(l) for l in lines]
errors = collections.Counter((r["robot"], r["event"]) for r in recs if r["level"] == "ERROR")
print("errors by robot and event:", dict(errors))
resets = [r for r in recs if r["event"] == "loc_reset" and r["cov"] > 0.5]
gaps = [b["t"] - a["t"] for a, b in zip(resets, resets[1:])]
print(f"localization resets with cov > 0.5: {len(resets)}, mean interval {sum(gaps) / len(gaps):.1f} s")errors by robot and event: {('r07', 'loc_reset'): 3}
localization resets with cov > 0.5: 3, mean interval 9.4 sRecording data with rosbag2
Logs record events; recordings capture the data itself. rosbag2 records ROS 2 topics to files, by default in the MCAP format, which is self-describing, indexed and readable by visualization tools such as Foxglove and PlotJuggler. Recording everything all the time is rarely possible: a robot with several cameras and lidars can produce gigabytes per minute. Common strategies are to record low-rate topics (states, commands, diagnostics, estimates) continuously, keep a rolling buffer of high-rate sensor data in memory or on disk, and save the buffer around interesting events, a 'black box' recording triggered by a fault, an emergency stop, an operator report or an anomaly detector. ROS 2 supports this pattern through rosbag2 snapshot mode.
Worked problem
Sizing on-robot storage
A robot records 2 Mbit/s of low-rate topics continuously, and keeps a 60 s rolling buffer of sensor data at 200 Mbit/s, saving it on about 6 events per day. It works 20 hours a day and must keep 14 days of data. How much storage is needed?
Show solution
- Continuous: \( 2 \text{ Mbit/s} \times 72\,000 \text{ s} = 144\,000 \) Mbit = 18 GB per day.
- Event snapshots: \( 200 \times 60 = 12\,000 \) Mbit = 1.5 GB each, so 9 GB per day.
- Daily total about 27 GB; for 14 days about 378 GB, before compression.
Answer: About 380 GB, so a 512 GB drive with compression and upload of important snapshots works. Recording all sensor data continuously, at about 1.8 TB per day, would not.
Diagnostics and health monitoring
Beyond logs and recordings, each component should publish its health. ROS 2 provides the diagnostics framework: nodes publish diagnostic status messages with a level (OK, WARN, ERROR, STALE) and key-value details, and an aggregator groups them into a tree, for example 'Sensors / Front lidar' and 'Power / Battery'. Typical checks include topic rates (is the lidar publishing at 10 Hz?), latencies, temperatures, voltages, CPU and memory use, disk space, localization confidence and the age of the last command. A watchdog that marks a component STALE when it stops reporting is as important as the checks themselves, because a silent failure looks exactly like 'everything fine' to a dashboard that only shows the last value.
| Signal | Example check | Action when it fails |
|---|---|---|
| Topic rate | Front lidar below 8 Hz for 2 s | Slow to crawl speed, raise ERROR |
| Latency | Perception output older than 200 ms | Stop new motions, raise WARN |
| Localization quality | Pose covariance above threshold for 5 s | Stop, request relocalization |
| Power | Battery below 15 % | Abort mission, return to dock |
| Compute | CPU temperature above 90 °C | Throttle non-essential nodes, alert |
| Storage | Disk above 90 % full | Upload and prune recordings, alert |
Telemetry and observability
Observability is the ability to understand a system's internal state from its outputs. Software engineers describe three pillars: logs (discrete events), metrics (numeric time series, such as mission duration or battery level, cheap to store and aggregate) and traces (the path of one request through many components, with timing at each step). For robots, a trace might follow one sensor frame from the camera driver through detection, tracking, planning and control, showing exactly where latency accumulates; ROS 2 tracing tools based on LTTng and the OpenTelemetry standard support this kind of analysis.
Robots send a selected subset of telemetry to the fleet back end: metrics every few seconds, events and alerts immediately, recordings when bandwidth allows. A gateway on the robot buffers telemetry when the network is down and sends it later with original timestamps, and it never lets network problems block the robot's internal software. On the back end, time-series databases and dashboards (tools such as Prometheus and Grafana are common examples) show the fleet's state, and the same data feeds the release health checks used for staged rollout (lesson 7).
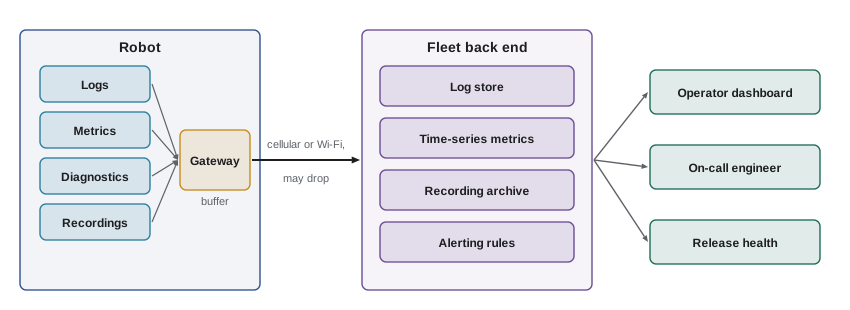
Fleet monitoring and alerting
With many robots, nobody can watch every dashboard. Alerting rules page a person only when action is needed: a robot stuck for more than five minutes, a site where mission success drops below a threshold, a rise in emergency stops across the fleet after a release. Good alerts are actionable, link to a runbook explaining what to check and do, and are tuned so that false alarms are rare; alert fatigue, like flaky tests, trains people to ignore the signal. Fleet-level views also reveal patterns no single robot shows: one site with many localization failures may have changed its layout, and one hardware batch with more motor faults may have a supplier problem.
Worked problem
Is an alert worth paging for?
An alert fires when a robot reports more than three localization resets in an hour. Over a month it fired 120 times; investigation shows 18 were real problems needing action. A second rule, five resets in an hour, would have fired 30 times and caught 16 of the 18. Compare the two rules.
Show solution
- Rule A precision: \( 18/120 = 15 \) %, catching all 18.
- Rule B precision: \( 16/30 \approx 53 \) %, catching 16 of 18, a recall of about 89 %.
- Rule B cuts pages by 75 % and misses 2 problems, which a daily report of three-reset robots could still catch.
Answer: Rule B with a daily report is the better design: far fewer false pages for on-call staff, with the borderline cases reviewed in normal hours.
Over-the-air updates and remote support
Over-the-air (OTA) updates deliver new software and configuration to robots in the field. A robust OTA system downloads in the background with resumable transfers, verifies cryptographic signatures, installs only when the robot is idle and docked, applies changes atomically, checks health after restart and rolls back automatically on failure, as outlined in lesson 7. Delta updates that send only changed layers or blocks reduce cellular data costs. Configuration, such as site maps, speed limits per zone and docking positions, should be versioned and deployed through the same controlled mechanism, not edited by hand on robots.
Remote support lets engineers inspect a robot from afar: view its diagnostics and recent logs, replay a snapshot, see camera feeds with the customer's permission and, sometimes, teleoperate it out of a stuck position. Every remote session must be authenticated, authorized for that robot, logged and, for teleoperation, constrained by the robot's own safety functions, which remain in charge regardless of what the remote operator commands. Lesson 10 treats these remote access paths as part of the attack surface.
Worked problem
Update bandwidth for a fleet
A 1.2 GB container update must reach 400 robots over cellular links averaging 8 Mbit/s, during a 4-hour overnight window. A delta update reduces the download to 180 MB. Can each robot finish in the window, and what is the total data?
Show solution
- Full image: \( 1.2 \times 8000 / 8 = 1200 \) s, about 20 minutes per robot at the average rate; total data 480 GB.
- Delta: \( 0.18 \times 8000 / 8 = 180 \) s, about 3 minutes; total data 72 GB.
- Both fit the window per robot, but the delta cuts cellular data by 85 %.
Answer: Both fit, but the delta update uses 72 GB instead of 480 GB across the fleet, a large saving on cellular plans and a smaller exposure to interrupted downloads.
Reliability metrics
Operations are judged by reliability numbers. Mean time between failures (MTBF) is the average operating time between failures that need intervention; mean time to repair or restore (MTTR) is the average time to get back into service; availability is the fraction of scheduled time the robot is working, approximately MTBF/(MTBF + MTTR). For mobile robots, interventions per hour or per kilometer, and missions completed without help, are often more meaningful to customers than raw MTBF.
import random
rnd = random.Random(9)
# Monte Carlo: availability of a robot with exponential failures and lognormal repair times
mtbf_h = 40.0                       # mean hours between interventions
def repair_h():                     # most fixes are remote (minutes), some need a site visit (hours)
    return rnd.lognormvariate(-1.2, 0.6) if rnd.random() < 0.85 else rnd.lognormvariate(1.0, 0.5)
up = down = 0.0; fails = 0
while up < 20 * 365:                # simulate a year of 20-hour days
    up += rnd.expovariate(1 / mtbf_h); fails += 1
    down += repair_h()
mttr = down / fails
print(f"failures: {fails}, MTTR {mttr:.2f} h, availability {up / (up + down):.4f}")
print(f"formula MTBF/(MTBF+MTTR) = {mtbf_h / (mtbf_h + mttr):.4f}")failures: 184, MTTR 0.76 h, availability 0.9813 formula MTBF/(MTBF+MTTR) = 0.9815
The simulation shows why remote support matters so much: most interventions resolved remotely in minutes keep the mean repair time low, and availability high, even though a minority of failures take hours. Halving the fraction of failures that need a site visit usually improves availability more than modest improvements in MTBF.
Common mistakes
MistakeWriting free-text log messages without robot or mission identifiers
InsteadUse structured logs with timestamps, levels and context keys.
MistakeLogging every sensor message from a control loop
InsteadThrottle, count or sample high-rate events and keep logging off real-time paths.
MistakeRecording all sensor data continuously
InsteadRecord low-rate topics continuously and snapshot high-rate data around events.
MistakeShowing only the last value on a health dashboard
InsteadMark components STALE when they stop reporting.
MistakePaging on-call staff for every warning
InsteadMake alerts actionable, tuned and linked to runbooks.
Summary and key terms
- Good logs are structured, timestamped and contextual, and logging must not overload robots or invade privacy.
- rosbag2 records topics, by default in MCAP; continuous low-rate recording plus event snapshots keeps storage manageable.
- The ROS 2 diagnostics framework publishes component health, and watchdogs mark silent components as stale.
- Observability rests on logs, metrics and traces, sent through a buffering gateway to the fleet back end.
- Fleet alerts must be actionable and tuned, and fleet views reveal site- and batch-level patterns.
- OTA updates and remote support need signatures, atomic installs, rollback, authorization and logging.
- MTBF, MTTR, availability and interventions per hour measure operational reliability.
- Structured logging
- Writing log records as key-value data that tools can search and aggregate.
- rosbag2
- The ROS 2 tool for recording and replaying topics.
- MCAP
- A self-describing, indexed file format for recorded robot data.
- Snapshot recording
- Keeping a rolling buffer and saving it when an event occurs.
- Diagnostics aggregator
- A node that groups component health reports into a tree.
- Observability
- The ability to understand internal state from logs, metrics and traces.
- Trace
- A record of one request or data item passing through many components, with timings.
- Alert fatigue
- Ignoring alerts because too many are false or unimportant.
- Over-the-air update
- Delivering software or configuration to robots remotely.
- Availability
- The fraction of scheduled time a system is working, about MTBF/(MTBF + MTTR).
Practice problems
Work each problem on paper first, then reveal the answer to check.
Name the ROS 2 log severity levels.
Show answer
DEBUG, INFO, WARN, ERROR and FATAL.
Why use structured logs?
Show answer
They can be searched and aggregated by machines across a fleet.
What is the default rosbag2 storage format in current ROS 2 releases?
Show answer
MCAP.
How many GB per day does a continuous 4 Mbit/s recording use over 10 hours?
Show answer
18 GB.
What does a STALE diagnostic level mean?
Show answer
The component has stopped reporting.
Name the three pillars of observability.
Show answer
Logs, metrics and traces.
Why must the telemetry gateway buffer data?
Show answer
Network links drop, and robot software must never block on them.
What makes an alert actionable?
Show answer
It indicates a needed action and links to a runbook.
What is availability with MTBF 50 h and MTTR 0.5 h?
Show answer
About 0.990.
Why are delta updates useful?
Show answer
They send only what changed, cutting data and download time.
Lesson quiz · 5 questions
Score 60% or more to complete this lesson.
Create a free account to save your progress, take quizzes and earn a certificate.