
SLS-298 · Lesson 11 of 12 · 27 min
The midseason review
▶ Video coming soon A video version of this lesson is on the way.
Halfway through a season is the last point at which a department can change its result. Stage 11 of the simulation is the midseason review: on Monday, May 17, 2027, Aiden presents the department's first three months to Bev Halvorsen, with Carl Jensen attending as the store's senior seller and a member of the planning group. The brief contains every result from stages 3 to 10, the May sales so far, and the July receipts that are still open to change. The deliverable is a midseason review pack: a scorecard against the season goals, an explanation of the main variances, a reforecast for May to July, and no more than three decisions, each with what it costs and what it will change.
The rule Bev gives every department lead is simple: a midseason review is not a report on what happened. It is a meeting to decide what happens next. A pack that explains February in detail and says nothing about June has failed, however accurate it is.
The scorecard
A scorecard puts each season goal next to its result to date, so that the reader can see in a minute where the department stands. Aiden's scorecard covers February 1 to April 30, the first half of the season by months and almost half by planned sales.
| Goal | Plan to April 30 | Actual to April 30 | Status |
|---|---|---|---|
| Sales | 890,000 dollars | 911,000 dollars | Ahead |
| Transactions | 500 | 506 | Ahead |
| Average sale | 1,780 dollars | 1,800 dollars | Ahead |
| Gross margin rate | 46.0 in 100 | 45.2 in 100 | Behind |
| Gross margin | 409,400 dollars | 411,772 dollars | Ahead |
| Markdowns | 71,200 dollars (8.0 in 100) | 79,800 dollars (8.8 in 100) | Behind |
| Shrink | 0.8 in 100 | 1.4 in 100 | Behind |
| Protection-plan attachment | 28 in 100 | 26 in 100 | Behind |
| Plan cancellations within 30 days | 5 in 100 or less | 3.8 in 100 | On goal |
| Satisfaction, 4 or 5 out of 5 | 90 in 100 | 88 in 100 | Behind |
The scorecard shows a familiar midseason pattern: the headline is good and the detail is mixed. Sales and gross margin dollars are ahead of plan, but the margin rate, markdowns, shrink, attachment and satisfaction are all behind. A lead who reported only the first line would be telling the truth and hiding the problem.
Explaining the sales variance
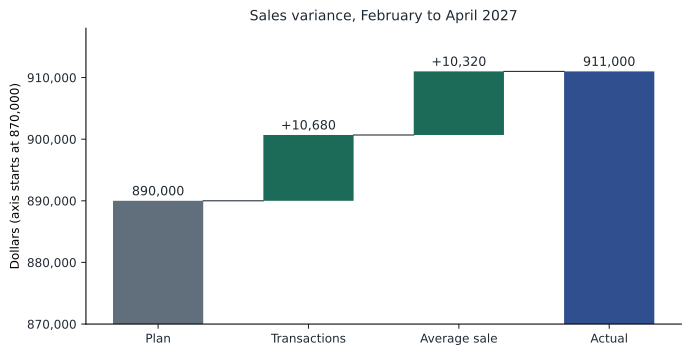
Sales were 21,000 dollars ahead of plan. Before deciding whether that will continue, Aiden split the variance into its two drivers: more transactions and a higher average sale.
Worked problem
Splitting the sales variance
The plan was 500 transactions at 1,780 dollars. The actual was 506 transactions at about 1,800.40 dollars. How much of the 21,000-dollar variance came from each driver?
Show solution
- Transaction effect, at the planned average sale:
- \[(506 - 500) \times 1{,}780 = 10{,}680 \text{ dollars}\]
- Average-sale effect, on the actual transactions:
- \[(1{,}800.40 - 1{,}780) \times 506 \approx 10{,}320 \text{ dollars}\]
- Check:
- \[10{,}680 + 10{,}320 = 21{,}000 \text{ dollars}\]
Answer: The variance came about equally from the two drivers. The extra transactions came mostly from the April promotion weekend. The higher average sale came from custom sectionals, Leon's coaching plan from stage 7 and the promotion's free-delivery threshold of 1,500 dollars. Both causes were partly one-off: the promotion will not repeat, so Aiden did not assume the full variance would continue.
Explaining the margin variance
Gross margin dollars were 2,372 dollars ahead, but the rate was 0.8 points behind. Both statements are true, and the review has to show why.
Worked problem
Splitting the margin variance
Planned gross margin was 409,400 dollars, 46 in 100 of 890,000. The actual was 411,772 dollars, 45.2 in 100 of 911,000. Split the variance into a volume effect and a rate effect.
Show solution
- Volume effect, the extra sales at the planned rate:
- \[21{,}000 \times 0.46 = 9{,}660 \text{ dollars}\]
- Rate effect, the lower rate on actual sales:
- \[(0.452 - 0.46) \times 911{,}000 \approx -7{,}288 \text{ dollars}\]
- Total:
- \[9{,}660 - 7{,}288 = 2{,}372 \text{ dollars}\]
Answer: The extra sales earned 9,660 dollars of margin, but the lower rate gave up 7,288 of it. Markdowns explain most of the rate gap: they ran 8,600 dollars above the plan for the period, including the promotion weekend's delivery cost, the terracotta discount and early clearance of damaged pieces. The unrecorded damage found in stage 9 had also been sold at reduced prices.
Checking the tests set earlier
Several earlier stages set tests to be checked at midseason. A review that skips them teaches the team that tests do not matter.
| Test (stage) | Rule set | Result to April 30 | Decision |
|---|---|---|---|
| 999 sofa line (5) | Pays for itself if at least 18 of 120 are new sales | 58 sold; sellers recorded 14 buyers who had been shopping a competitor's price, on pace for about 29 | Keep; reorder in June |
| Feature display (6) | Feature beats control by a clear margin | 118 groups and 3 sales against 46 and 1 | Keep feature layout |
| Terracotta test color (5, 8) | Reorder if 4 of 6 sell by mid-April | 3 by April 16; 5 of 6 after the discount | Do not reorder at full depth; offer as a special-order color |
| Promotion (8) | Net margin positive | Net plus 4,082 dollars | Repeat only with a smaller markdown element |
The terracotta decision shows the discipline the review needs. The color reached five of six, which sounds like success, but it needed a discount to get there. Aiden judged it by the rule he had set before the season, not by the final count, and kept it as a special-order color where it costs no stock.
The reforecast
A reforecast is a new estimate of the season's result, made with what the department now knows. It does not replace the plan; the plan stays as the measure the department is judged against. The reforecast tells the store what to expect.
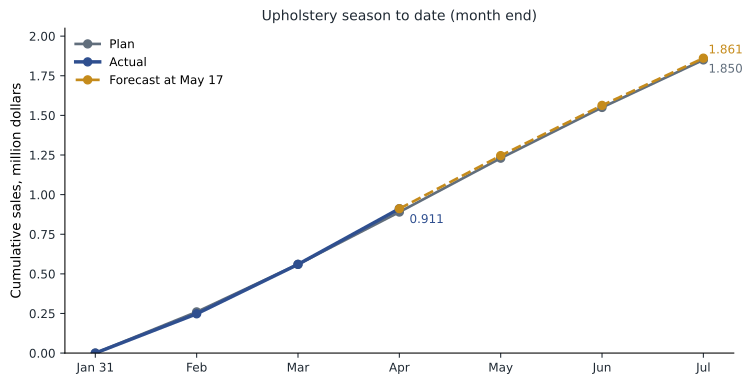
May sales to May 16 were running about 2 in 100 below plan, and Tessa reported that web traffic to upholstery pages was down a little from April. Without a promotion, Aiden expected May to July to come in slightly below plan.
Worked problem
The season reforecast
The plan for May to July is 960,000 dollars. Aiden forecasts 950,000. What is the forecast for the season, and how does it compare with the plan of 1,850,000?
Show solution
- Season forecast:
- \[911{,}000 + 950{,}000 = 1{,}861{,}000 \text{ dollars}\]
- Against plan:
- \[1{,}861{,}000 - 1{,}850{,}000 = 11{,}000 \text{ dollars}\]
- As a share of plan:
- \[\frac{11{,}000}{1{,}850{,}000} \approx 0.006\]
Answer: The forecast is 1,861,000 dollars, 11,000 above plan, or about 0.6 in 100. Aiden presented it as a range of 1,840,000 to 1,880,000, because a 2 in 100 swing in June or July would move it by about 20,000.
Worked problem
What margin rate does the rest of the season need?
The season goal is 851,000 dollars of gross margin. Margin to April 30 was 411,772. If May to July sales are 950,000, what gross margin rate is needed from May to July to reach the goal?
Show solution
- Margin still needed:
- \[851{,}000 - 411{,}772 = 439{,}228 \text{ dollars}\]
- Rate needed:
- \[\frac{439{,}228}{950{,}000} \approx 0.462\]
Answer: The department needs about 46.2 in 100 for the rest of the season, slightly above the plan rate, to make up for the first half. That sets the limit on markdowns for May to July.
Worked problem
The markdown budget left
The season markdown budget is 148,000 dollars and 79,800 has been used. What is left, and what rate of the forecast May to July sales does that allow?
Show solution
- Budget left:
- \[148{,}000 - 79{,}800 = 68{,}200 \text{ dollars}\]
- Rate on forecast sales:
- \[\frac{68{,}200}{950{,}000} \approx 0.072\]
Answer: About 7.2 in 100 for May to July, against 8.0 in the plan. The May floor-model clearance from stage 9 takes 4,100 of it, and the July end-of-season clearance must be planned inside what remains.
Adjusting July receipts
Because the reforecast lowers May to July sales by 10,000 dollars, Aiden lowered July receipts. With a cost complement of 54 in 100, 10,000 dollars of retail is about 5,400 dollars at cost. He canceled four accent chairs from a July order that had not yet been confirmed by the supplier, worth about 5,300 at cost, and kept the reserve from stage 5 for the gray sectional reorder in stage 9. Canceling stock that has not shipped is far cheaper than marking it down in August.
The attachment decision
The hardest decision in the review was about protection-plan attachment. To reach 28 in 100 for the whole season, the department would need to sell about 158 plans on the roughly 528 transactions expected from May to July.
Worked problem
What would catching up require?
There have been 132 plans on 506 transactions. If May to July brings about 528 transactions, what attachment rate would those months need for the season to reach 28 in 100?
Show solution
- Plans needed for the season:
- \[0.28 \times (506 + 528) \approx 290\]
- Plans still needed:
- \[290 - 132 = 158\]
- Rate needed from May to July:
- \[\frac{158}{528} \approx 0.30\]
Answer: The department would need 30 in 100 for the rest of the season. April had already reached about 32 in 100 after the coaching in stage 7, so it is possible. But stage 3 set a cancellation limit for a reason: pressure to catch up is how sellers start pushing plans that customers cancel.
Aiden recommended keeping the monthly target at 28 in 100 and not setting a catch-up target. He would rather miss the season goal by a point than see cancellations rise and customers feel pushed. Bev agreed, and asked him to report cancellations with attachment in every weekly huddle.
Three decisions
| Decision | Cost | What it should change | Owner |
|---|---|---|---|
| Apply the delivery reconfirmation standard and lead-time script from stage 10 to all special orders from May 17 | About 6 hours a week of seller and office time | Timing complaints down to 4 a month or fewer; satisfaction to 90 in 100 | Aiden, with Carl coaching |
| Hold markdowns to 68,200 dollars for the rest of the season; July clearance planned within it | No direct cost | Margin rate of at least 46.2 in 100 for May to July | Aiden |
| Keep shrink actions from stage 9; weekly damage review and cycle count | About 2 hours a week | Shrink at or below 0.8 in 100 for May to July | Aiden, with Marcus |
Template: the midseason review pack
| Section | What to include |
|---|---|
| Scorecard | Every season goal, plan and actual to date, status |
| Variances | The two or three largest, split into their drivers |
| Tests | Each test set earlier, its rule and the decision |
| Reforecast | Season forecast as a number and a range; margin and markdown limits for the rest of the season |
| Decisions | No more than three, each with cost, expected change and owner |
| Risks | What could move the forecast, and what the department will watch |
Model answer and Bev's scoring
Bev scored the pack 19 out of 20, the highest score of the season. She gave full marks for the scorecard, which showed every goal including the ones behind, for the variance analysis, and for the decisions. She took one point from the reforecast because the risk section named the June trade-area road construction that Tessa had flagged but did not say what the department would do if traffic fell more than expected. Carl added a note of his own: the attachment decision was the one he would remember, because it put the customer ahead of a number on the scorecard.
| Criterion | Excellent (4) | Developing (2) | Aiden |
|---|---|---|---|
| Scorecard | Every goal shown honestly with status | Only favorable results shown | 4 |
| Variance analysis | Variances split into drivers, causes explained | Totals only | 4 |
| Tests | Each test judged by its rule | Tests ignored or judged afterwards | 4 |
| Reforecast | Number, range and limits for the rest of the season | Plan repeated | 3 |
| Decisions | Three or fewer, costed and owned | A long list of intentions | 4 |
Reflection
Why is it tempting to lead a midseason review with the best number? Would you have set a catch-up target for attachment? What would you need to believe for that to be the right call?
Common mistakes
MistakeReporting only the results that are ahead of plan.
InsteadShow every goal, with its status.
MistakeExplaining a variance as a single number.
InsteadSplit it into its drivers, such as transactions and average sale, or volume and rate.
MistakeReplacing the plan with the reforecast.
InsteadKeep the plan as the measure and use the reforecast to guide decisions.
MistakeJudging a test by its final count after the fact.
InsteadJudge it by the rule set before the season.
MistakeSetting catch-up targets that invite pressure selling.
InsteadKeep targets that protect the customer, and report the guardrail alongside.
Summary and key terms
- A midseason review decides what happens next; it is not only a report on what happened.
- The scorecard shows every goal honestly: sales and margin dollars were ahead, but margin rate, markdowns, shrink, attachment and satisfaction were behind.
- Sales variance split into transactions (10,680 dollars) and average sale (10,320); margin variance into volume (9,660) and rate (minus 7,288).
- The reforecast was 1,861,000 dollars, with a range, and set limits for the rest of the season: a margin rate of about 46.2 in 100 and 68,200 dollars of markdowns.
- Three costed decisions with owners are better than a long list.
- Scorecard
- A table showing each goal, its result to date and its status.
- Variance
- The difference between an actual result and the plan.
- Volume effect
- The part of a margin variance caused by selling more or less.
- Rate effect
- The part of a margin variance caused by a higher or lower margin rate.
- Reforecast
- An updated estimate of the season's result, made during the season.
- Cost complement
- One minus the markup on retail; the share of a retail price that is cost.
Practice problems
Work each problem on paper first, then reveal the answer to check.
Plan: 400 transactions at 1,500 dollars. Actual: 420 at 1,480. Split the variance.
Show answer
Transaction effect 20 × 1,500 = 30,000; average-sale effect (1,480 − 1,500) × 420 = −8,400; total 21,600.
Margin to date is 300,000 dollars, the season goal is 640,000, and the rest of the season is forecast at 720,000 dollars of sales. What rate is needed?
Show answer
340,000 ÷ 720,000 ≈ 0.472, about 47.2 in 100.
Why might a lead decline to set a catch-up attachment target?
Show answer
Because pressure to catch up tends to raise cancellations and harm customer trust.
Lesson quiz · 5 questions
Score 60% or more to complete this lesson.
Create a free account to save your progress, take quizzes and earn a certificate.