
CON-345 · Lesson 12 of 12 · 24 min
Capstone: quality metrics, culture and a quality plan
The previous lessons followed Larkspur Commons from its quality plan through inspections, tests, reviews, nonconformances and deficiencies. This capstone steps back to ask two questions. How does a team know whether its quality program is working, and how does it keep improving? And what makes people on site actually care about quality, rather than treating it as paperwork? The lesson ends by bringing everything together in a quality plan for Thornbury's next project, a building the team is about to start.
Measuring quality
Lesson 1 introduced first-time quality and the cost of quality. A small set of measures, tracked monthly and discussed openly, tells the team far more than a thick binder of inspection forms. Lena's quality dashboard for Larkspur Commons uses the measures below. Each has a clear definition so that results can be compared over time and between projects.
| Measure | Definition | Why it matters |
|---|---|---|
| First-time pass rate | Share of inspected items passing the first time, by inspection type | Shows whether work is right before it is checked |
| NCRs per month and per million dollars of work | Count of nonconformance reports, normalized by work put in place | Shows the rate of significant problems |
| NCR closure time | Average and maximum days from opening to closing | Long-open NCRs block work and hide risk |
| Self-reported share | Share of NCRs reported by the installing trade or the contractor | Indicates whether the culture encourages reporting |
| Deficiencies per home at consultant inspection | Consultant's items divided by homes inspected | Shows the quality of finished work at handover |
| Cost of quality | Prevention, appraisal and failure costs as a share of work put in place | Links quality to money |
| Repeat causes | Number of NCRs with a cause already addressed by a corrective action | Shows whether corrective actions work |
Numbers can be gamed. If foremen are judged only on the NCR count, they will stop reporting NCRs. That is why the dashboard pairs measures that pull in different directions: the NCR count goes with the self-reported share, and the first-time pass rate goes with the number of inspections done. A project with few NCRs and a falling self-reported share is not necessarily improving; it may be hiding problems.
Control charts for first-time quality
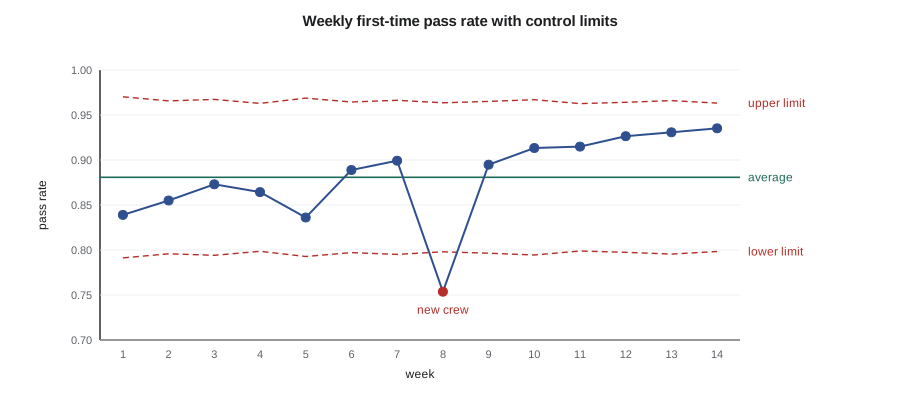
Weekly first-time pass rates go up and down. Some of that is noise, and some is a real change. A control chart helps tell them apart. For a proportion such as the pass rate, the usual chart is a p-chart: the centre line is the average pass rate, and the control limits are set about three standard errors either side, with the standard error depending on the number of items inspected each week. A point outside the limits, or a run of points on one side of the centre line, signals a real change worth investigating. PMP-131 introduced control charts; here is one applied to the contractor's inspections on the wood-frame floors.
# p-chart of weekly first-time pass rate, contractor inspections on the wood-frame floors (illustrative)
import math
weeks = [  # (items inspected, passed first time)
    (118, 99), (131, 112), (126, 110), (140, 121), (122, 102), (135, 120), (129, 116),
    (138, 104), (133, 119), (127, 116), (141, 129), (136, 126), (130, 121), (139, 130),
]
n_tot = sum(n for n, _ in weeks); p_tot = sum(p for _, p in weeks)
pbar = p_tot / n_tot
print(f"average {pbar:.3f}")
for w, (n, p) in enumerate(weeks, 1):
    se = math.sqrt(pbar * (1 - pbar) / n)
    lcl, ucl = max(0, pbar - 3 * se), min(1, pbar + 3 * se)
    rate = p / n
    flag = "BELOW LCL" if rate < lcl else ("ABOVE UCL" if rate > ucl else "")
print(f"week {w:2d}: {rate:.3f} limits {lcl:.3f}-{ucl:.3f} {flag}".rstrip())average 0.881 week 1: 0.839 limits 0.791-0.970 week 2: 0.855 limits 0.796-0.966 week 3: 0.873 limits 0.794-0.967 week 4: 0.864 limits 0.799-0.963 week 5: 0.836 limits 0.793-0.969 week 6: 0.889 limits 0.797-0.964 week 7: 0.899 limits 0.795-0.966 week 8: 0.754 limits 0.798-0.964 BELOW LCL week 9: 0.895 limits 0.796-0.965 week 10: 0.913 limits 0.794-0.967 week 11: 0.915 limits 0.799-0.963 week 12: 0.926 limits 0.797-0.964 week 13: 0.931 limits 0.795-0.966 week 14: 0.935 limits 0.798-0.963
Week 8 fell below the lower control limit: that week, a new drywall crew started on level 5 and many of its first items failed, the situation lesson 5 describes. The crew's initial phase was repeated and the following weeks recovered. The last six weeks are all above the centre line, a run that is unlikely to be chance, which is a good signal: the process has improved, and the centre line and limits should be recalculated from recent data so that future problems are judged against the better standard. The chart did not tell anyone what to do, but it told them where to look.
Choosing a sampling plan
Lesson 3 showed that the chance of a sample finding at least one defect depends on the sample size and the defect rate. A sampling plan goes one step further: it sets the sample size and the number of defects allowed before the lot, such as a zone's firestops or a floor's windows, is rejected for full inspection. The operating characteristic curve shows how likely a plan is to accept lots of different quality. A good plan accepts good lots almost always and rejects bad lots almost always; the steeper the curve, the better it discriminates.
# Operating characteristic of two sampling plans for a zone of 300 firestops (illustrative)
from math import comb
N = 300
def p_accept(n, c, D):
    """Probability a random sample of n contains at most c defectives when the lot has D."""
    return sum(comb(D, k) * comb(N - D, n - k) for k in range(0, c + 1)) / comb(N, n)
plans = {"n=30, c=1": (30, 1), "n=60, c=2": (60, 2)}
print("defect rate   " + "   ".join(f"{name:>10s}" for name in plans))
for rate in (0.01, 0.02, 0.05, 0.08, 0.12):
    D = round(N * rate)
    row = "   ".join(f"{p_accept(n, c, D):10.2f}" for n, c in plans.values())
print(f" {rate:5.0%} {row}")defect rate n=30, c=1 n=60, c=2
1% 0.97 0.99
2% 0.89 0.90
5% 0.55 0.39
8% 0.28 0.10
12% 0.10 0.01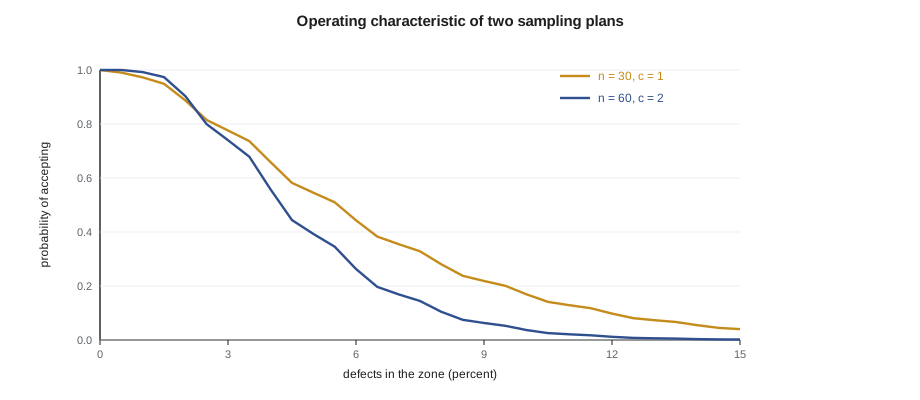
The larger plan, 60 items with up to two defects allowed, accepts a zone with 1 percent defects nearly every time and one with 2 percent about nine times in ten, but accepts a zone with 8 percent defects only about one time in ten, while the smaller plan would accept it about 28 percent of the time. For firestopping, where a bad zone means life-safety risk, Lena chose the larger plan, combined with the installer's full self-inspection and the building official's hold point. For paint touch-ups, a small plan is enough. Sampling plans are a way to spend inspection effort where it buys the most confidence.
Results on Larkspur Commons
By the time the last floor was handed over, the wood-frame and envelope phases could be compared with the podium phase from lesson 1. The comparison is not perfect, because the work was different, but the direction is clear.
# Podium phase versus wood-frame and envelope phases (illustrative)
phases = {
    "podium":                 {"cost": 14_800, "prev": 89, "appr": 183, "fail": 348, "ftq": 0.87, "ncr": 31},
    "wood frame and envelope": {"cost": 27_600, "prev": 214, "appr": 296, "fail": 402, "ftq": 0.91, "ncr": 38},
}
for name, d in phases.items():
    total = d["prev"] + d["appr"] + d["fail"]
    print(f"{name:24s} cost of quality {total / d['cost']:.1%} of work; failure {d['fail'] / d['cost']:.1%}; "
f"prevention {d['prev'] / d['cost']:.1%}; first-time pass {d['ftq']:.0%}; NCRs per million dollars {d['ncr'] / (d['cost'] / 1000):.1f}")podium cost of quality 4.2% of work; failure 2.4%; prevention 0.6%; first-time pass 87%; NCRs per million dollars 2.1 wood frame and envelope cost of quality 3.3% of work; failure 1.5%; prevention 0.8%; first-time pass 91%; NCRs per million dollars 1.4
Prevention spending more than doubled in absolute terms and rose as a share of the work, and failure costs fell from about 2.4 percent of the work to about 1.5 percent. NCRs per million dollars fell and the first-time pass rate rose. The total cost of quality as a share of work fell too. These figures are illustrative and drawn from one invented project, but the pattern is the one quality programs aim for: spend more on getting it right, and less on fixing it.
Quality culture
Systems and measures matter, but in the end quality is made by people deciding, many times a day, whether to do the job right or just get it done. A quality culture is one in which doing it right is the normal choice, even when nobody is watching and the schedule is tight. It is built by leaders' behaviour more than by posters.
| Practice | What it looks like on site |
|---|---|
| Leaders show it matters | Dana walks the work with the foremen and asks about quality as often as about progress; he backs a stop-work for quality |
| Clear standards | Approved mock-ups and first work show what good looks like; foremen walk crews through them |
| Quality in pre-task planning | Daily huddles cover the quality points for the day's work, not only safety and production |
| See it, own it, fix it | Anyone who sees a defect reports it or fixes it, including in another trade's work, without blame |
| Recognition | Crews with high first-time pass rates are recognized at the coordination meeting |
| Learning, not blame | NCRs lead to process fixes; self-reporting is treated as good news |
| Trades involved | Subcontractor foremen help write ITPs and attend the monthly quality review |
Quality and safety culture overlap almost completely. The same practices, planning the task, checking conditions before starting, stopping when something looks wrong, reporting problems without fear, learning from incidents and near misses, prevent both injuries and defects. Crews that are rushed and pressured cut corners on both. CON-355 covers safety leadership for site supervisors; most of what it says about leading safety applies to leading quality, and the two should be led together rather than as competing priorities.
Psychological safety, the belief that one can raise a concern or admit a mistake without being punished, is central to both. On Larkspur Commons, the moment that changed the drywall crew's attitude was not a rule but a conversation: when a young taper told Omar that she thought the crew had been skipping the second coat in closets to keep up, Omar thanked her in front of the crew, slowed the takt for that wagon by half a day, and the problem stopped. People keep reporting when reporting is rewarded.
Digital tools in quality
Digital tools have changed how quality is recorded and, increasingly, how it is checked. Thornbury uses an inspection application for checklists, photos and NCRs on tablets; reality capture (CON-315) to compare installed work with the model; and wireless sensors in the transfer slab that report concrete temperature, which the maturity method (CON-325) converts into estimated strength to support stressing decisions alongside field-cured cylinders. Drones photograph the roof and envelope for progress and for spotting obvious defects such as missing flashings.
Tools help, but they do not inspect. A photo of a firestop proves it existed; it does not prove it was the right system unless someone checked. The risk with digital tools is that records become easier to create than to read. Lena's rule is that every type of record must have someone who looks at it and a reason to look, which is why the dashboard draws directly from the inspection application. As of 2026, many contractors are also trying software that uses image recognition or artificial intelligence to flag possible defects in photos and scans. These tools are developing quickly and can help direct attention, but their findings still need a competent person's judgment before work is accepted or rejected.
Lessons learned
The final step in the plan-do-check-act cycle is to carry lessons to the next project. Thornbury holds a quality lessons-learned session at the end of each major phase, not only at the end of the project, while the people who know what happened are still on site. Each lesson is written as a specific change to a procedure, checklist, ITP or specification review item, so that it can actually be used.
| Lesson from Larkspur Commons | Change for the next project |
|---|---|
| Reinforcing pushed out of position by conduit tied to the mat | Pre-pour ITP step: check that no services are tied to reinforcing; cover check at every embedded conduit run |
| Shop drawing moved a connection away from cast-in bolts | Submittal checklist step: compare shop drawings with as-built embeds; detailers to cloud all changes |
| Window sill corners misunderstood | Envelope mock-up with water test mandatory; sill sequence sketches issued with the preinstallation minutes |
| New crews on identical work made first-work errors | Any new crew goes through preparatory and initial phases |
| Unassigned damage made up a fifth of deficiency items | Photograph each suite at each handoff; dedicated protection crew from drywall onward |
| Air leaks at rim joints and electrical boxes | Zone air test before drywall on the first floor of each building; sealing details in the ITP |
Capstone: a quality plan for the next project
Thornbury's next project is Cedar Hollow, an invented five-storey seniors' residence of 96 suites with a single-storey concrete podium for parking and amenity space and four storeys of wood frame above, with a larger kitchen and dining area and more complex mechanical systems than Larkspur Commons. It is in the same region, with the same owner's consultants. Lena has asked Mei to draft the project quality plan, using what the team learned. The outline below is Mei's draft. Readers can use it as a model and adapt it to a project of their own.
| Plan element | Cedar Hollow draft |
|---|---|
| Objectives | First-time pass rate at least 92 percent on contractor inspections; no more than 4 consultant deficiencies per suite; failure cost below 1.5 percent of work; self-reported NCR share at least 60 percent |
| Organization | Superintendent; field engineer as quality lead with stop-work authority; quality manager audits monthly; each subcontractor names a quality person |
| Requirements register | Built from every specification section in the first two weeks; coverage check before construction |
| Risk ranking | Firestopping, envelope at windows and balconies, kitchen exhaust and grease duct, fire separations around the kitchen, shear walls, and the podium waterproofing ranked highest |
| ITPs and hold points | Full ITPs for the top-ranked features; hold points before pours, before closing fire separations, before cladding, before ceilings in the kitchen |
| Submittals and mock-ups | Submittal register worked back from need dates; envelope mock-up with water test; first finished suite as the standard; kitchen equipment coordination review |
| Three-phase control | Preparatory and initial phases for every definable feature and every new crew; learning day in the look-ahead |
| Testing and reviews | Concrete, soils, steel and fireproofing testing per the specification; tracker for reviews, reports and open items; review of gaps three months before completion |
| Nonconformance | Seven-step process; root cause for every NCR over 5,000 dollars or repeated cause; effectiveness checks |
| Deficiencies | Progressive closure by suite; handoff photographs; protection crew; contractor walk before consultant inspection |
| Measures and culture | Monthly dashboard with paired measures; p-chart of first-time quality; recognition at coordination meetings; quality points in daily huddles |
| Records and closeout | All records in the inspection application, retained well beyond the warranty period; warranty register |
The plan is shorter than Larkspur Commons's was at the same stage, because much of the detail now lives in Thornbury's updated procedures and checklists, which the plan references rather than repeats. The final check Mei runs on the draft is whether a new foreman, reading the parts that apply to his trade, could answer Lena's three questions from lesson 2: which inspections apply to my work this week, who signs them off, and what happens if something fails. If he can, the plan is ready to use.
# Quick check of the draft plan's objectives against Larkspur Commons results (illustrative)
targets = {"first-time pass rate": (0.92, ">="), "consultant deficiencies per suite": (4.0, "<="),
           "failure cost share": (0.015, "<="), "self-reported NCR share": (0.60, ">=")}
larkspur = {"first-time pass rate": 0.91, "consultant deficiencies per suite": 4.6,
            "failure cost share": 0.0146, "self-reported NCR share": 0.61}
for k, (t, op) in targets.items():
    v = larkspur[k]
    met = v >= t if op == ">=" else v <= t
print(f"{k:34s} target {op} {t:<6} Larkspur result {v:<7} {'already met' if met else 'needs improvement'}")first-time pass rate target >= 0.92 Larkspur result 0.91 needs improvement consultant deficiencies per suite target <= 4.0 Larkspur result 4.6 needs improvement failure cost share target <= 0.015 Larkspur result 0.0146 already met self-reported NCR share target >= 0.6 Larkspur result 0.61 already met
Two targets are already being met, at the level Larkspur Commons finished at, and two will need improvement. That is deliberate. A plan whose targets are all already met does not ask the team to get better, and one whose targets are far beyond what the team has shown it can do will be ignored. The targets for Cedar Hollow ask for a modest step up on first-time quality and on finished-suite deficiencies, the two areas where the lessons learned table suggests the biggest gains remain.
Common mistakes
MistakeTracking a single quality measure such as the NCR count.
InsteadUse paired measures, such as NCR count with self-reported share, so that hiding problems shows up.
MistakeReacting to every weekly change in a pass rate.
InsteadUse a control chart to separate real changes from noise, and investigate points outside the limits or sustained runs.
MistakeUsing the same small sample for every activity.
InsteadChoose sampling plans by risk, using the operating characteristic to see how well each plan discriminates.
MistakeTreating quality and safety as competing priorities.
InsteadLead them together; the same practices and the same psychological safety support both.
MistakeWriting lessons learned as general observations.
InsteadTurn each lesson into a specific change to a procedure, checklist, ITP or review item.
Summary and key terms
- A small dashboard of clearly defined, paired measures tells a team whether its quality program is working.
- A p-chart of first-time pass rates separates real changes from noise; points outside the limits point to where to look.
- Sampling plans and their operating characteristic curves show how well inspection effort discriminates good lots from bad.
- On Larkspur Commons, higher prevention spending was followed by lower failure costs, fewer NCRs per million dollars and a higher first-time pass rate.
- Quality culture is built by leaders' behaviour, clear standards, involvement of the trades, recognition and learning without blame.
- Quality and safety culture overlap almost completely and depend on psychological safety.
- Digital tools make records easier to keep and analyse but do not replace competent inspection; every record needs a reader.
- Lessons learned become specific changes, and the next project's quality plan builds on them with targets that ask for real improvement.
- Quality dashboard
- A small set of quality measures tracked and reviewed regularly.
- Paired measures
- Measures chosen to pull in different directions so that gaming one shows up in the other.
- p-chart
- A control chart for a proportion, such as a weekly pass rate, with limits based on sample size.
- Control limits
- Boundaries on a control chart outside which variation is unlikely to be random.
- Sampling plan
- A rule setting the sample size and the number of defects allowed before a lot is rejected.
- Operating characteristic curve
- A curve showing the probability that a sampling plan accepts lots of different quality.
- Quality culture
- Shared values and behaviours that make doing the work right the normal choice.
- Psychological safety
- The belief that one can raise concerns or admit mistakes without being punished.
Practice problems
Work each problem on paper first, then reveal the answer to check.
Why does the dashboard pair the NCR count with the self-reported share?
Show answer
A falling NCR count with a falling self-reported share may mean problems are being hidden, not that quality is improving.
In the p-chart, which week signalled a problem and what had happened?
Show answer
Week 8, when a new drywall crew started on level 5 and many first items failed.
Under the n=60, c=2 plan, roughly how often is a zone with 8 percent defects accepted?
Show answer
About one time in ten, compared with about 28 percent for the smaller plan.
How did failure cost as a share of work change between the podium and the later phases?
Show answer
It fell from about 2.4 percent to about 1.5 percent.
What did Omar do when a taper reported that the crew was skipping coats in closets?
Show answer
He thanked her in front of the crew and slowed the takt for that wagon, and the problem stopped.
Which Cedar Hollow targets were already met at Larkspur's level, and why is that deliberate?
Show answer
Failure cost share and self-reported share; mixing met and stretch targets asks for realistic improvement.
Lesson quiz · 5 questions
Score 60% or more to complete this lesson.
Create a free account to save your progress, take quizzes and earn a certificate.