
LES-102 · Lesson 12 of 12 · 24 min
Capstone: evidence-based policing and a crime problem analysis
▶ Video coming soon A video version of this lesson is on the way.
The last class of the course has two parts. In the first, Professor Desjardins brings together everything the class has learned about theory and evidence and shows how police services use it, under the name evidence-based policing. In the second, each student presents a crime problem analysis: a short report that takes a real problem in Port Ardent, describes it with data, explains it with criminological theory and proposes responses that the evidence supports. At the end he hands back the cards on which the students wrote their beliefs about crime in the first class.
The capstone is meant to be practical. Patrol officers, supervisors, analysts and community partners all face the same basic question: there is a problem, so what should we do about it? A good answer requires the skills of the whole course. You need to measure the problem honestly, knowing the limits of police data. You need to understand why it happens, drawing on the theory that fits. And you need to choose responses that have worked elsewhere, then check whether they worked here.
What evidence-based policing means
In 1998 the criminologist Lawrence Sherman gave a lecture to the Police Foundation in Washington titled Evidence-Based Policing. He argued that policing should follow the path that medicine had taken: decisions should be based on the best available research about what works, and police services should test their own practices. Sherman later summarized the approach in three words: targeting, testing and tracking. Police should target their resources on the people, places and times where harm is concentrated; test their methods with rigorous research; and track whether their actions are delivering the results intended.
Evidence-based policing does not mean that officers stop using judgement or that every decision waits for a study. Most of what an officer does on a call depends on training, law and experience. It means that when a service decides how to deploy patrols, which programs to adopt and which practices to keep, it should ask what the evidence says and be willing to change course. The Canadian Society of Evidence-Based Policing, founded in 2015, brings together officers, civilians and researchers to promote this approach, and several Canadian services have run their own field experiments. Linh notes that many of the people leading this work are crime analysts and front-line officers, not only professors.
How strong is the evidence?
Not all evidence is equally convincing. Researchers at the University of Maryland developed a simple ranking in the late 1990s, now known as the Maryland Scientific Methods Scale, to rate evaluations of crime prevention programs. At level 1, a study finds only a correlation at one point in time, such as lower crime in areas with more cameras. At level 2, it compares crime before and after a program in the same place, with no comparison area. At level 3, it compares before and after in both a program area and a similar comparison area. At level 4, it compares several program and comparison areas while controlling for other differences. At level 5, places or people are randomly assigned to receive the program or not.
Randomization matters because it makes the program and comparison groups alike in every respect except the program, on average, so differences in outcomes can be attributed to the program. Without randomization, there are always rival explanations. A service might put extra patrols in places where crime was already about to fall, or a program might enrol the most motivated young people, who would have done well anyway. Police science has a growing number of randomized experiments, from the Minneapolis hot spots experiment in the 1990s to trials of body-worn cameras and procedural justice training. Professor Desjardins reminds the class of the crime decline in lesson 9: before-and-after comparisons during a period when crime is falling everywhere can make almost any program look successful.
The SARA model of problem solving
The most widely used framework for problem-oriented policing is the SARA model, developed by John Eck and William Spelman in a project with the police in Newport News, Virginia, in the 1980s. It has four stages. Scanning identifies recurring problems, often from calls for service data, complaints and officers' knowledge, and selects one to work on. Analysis gathers data on the problem and uses theory, often the problem analysis triangle from lesson 10, to understand why it occurs. Response chooses and implements actions that address the causes, drawing on what has worked elsewhere and involving partners. Assessment measures whether the response worked and feeds back into further scanning.
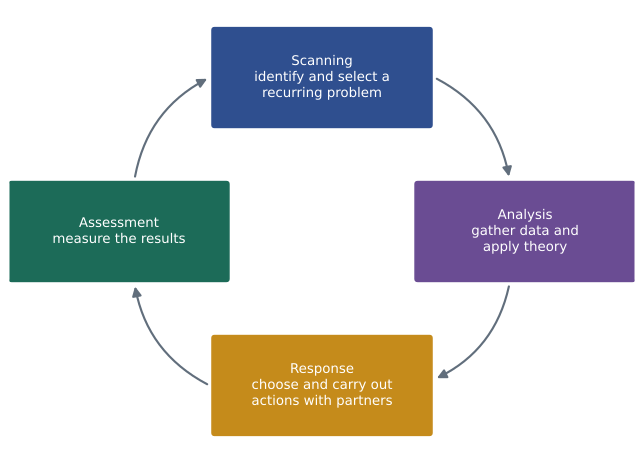
Problem-oriented policing has good evidence behind it. A systematic review of evaluations found that problem-solving efforts reduced crime and disorder on average, and many of the strongest successes, such as the Kirkholt burglary project and Boston's Operation Ceasefire, followed this logic. Herman Goldstein, who proposed problem-oriented policing in 1979, argued that police had become preoccupied with the means of their work, such as response times and arrests, rather than its ends, which are reducing harm and solving problems. The SARA model is a way of keeping attention on the ends.
Hot spots policing in practice
Hot spots policing is the most thoroughly tested police strategy. It follows directly from the law of crime concentration in lesson 9: if a small share of places produces a large share of crime, police attention focused on those places should prevent more crime than attention spread across the whole city. Systematic reviews of dozens of randomized and quasi-experimental studies find that hot spots policing reduces crime in the targeted places without large displacement, and often with diffusion of benefits to nearby areas. Approaches that solve problems at the hot spots, rather than only increasing patrol presence, tend to produce larger and more lasting effects.
A practical finding concerns how long officers should stay. The criminologist Christopher Koper studied patrol data from Minneapolis and found that the deterrent effect of a police stop at a hot spot grew with its length up to about 15 minutes and then declined, an idea now called the Koper curve. Several services have tested patrol plans in which officers make short, unpredictable visits of about 15 minutes to each hot spot during their shifts. Several Canadian services have adapted hot spot patrol plans of this kind, drawing on a randomized trial in Sacramento, California, in 2011 that found reductions in calls and serious crime in the treated hot spots.
Port Ardent ran its own small test in 2025. Linh's supervisor, the crime analyst, randomly assigned 20 of the city's 40 busiest street segments to receive three 15-minute patrol visits during each evening shift for twelve weeks, while the other 20 continued with normal patrol. The code below compares the change in calls for service between the two groups and uses a permutation test to estimate how often a difference this large would arise by chance if the patrols had no effect.
import random
# change in calls for service on each segment: 12 weeks of the trial minus the same 12 weeks a year earlier
treated = [-9, -4, -12, -6, 2, -7, -3, -10, -5, -1, -8, -6, 0, -4, -11, -2, -7, -5, -3, -6]
control = [-2, 1, -5, 3, -1, -4, 2, 0, -3, -6, 1, -2, 4, -1, -3, 0, 2, -5, -1, 1]
mean = lambda xs: sum(xs) / len(xs)
observed = mean(treated) - mean(control)
print(f"treated mean change {mean(treated):+.2f}, control mean change {mean(control):+.2f}")
print(f"difference: {observed:+.2f} calls per segment")
# permutation test: shuffle the labels many times and count differences at least this large
random.seed(2025)
pooled = treated + control
trials, extreme = 20000, 0
for _ in range(trials):
    random.shuffle(pooled)
    if mean(pooled[:20]) - mean(pooled[20:]) <= observed:
        extreme += 1
print(f"share of shuffles with a difference this large: {extreme / trials:.4f}")treated mean change -5.35, control mean change -0.95 difference: -4.40 calls per segment share of shuffles with a difference this large: 0.0001
Calls fell on both groups of segments, because calls fell across the city in 2025, but they fell by about four and a half more calls per segment on the treated segments than on the control segments. In fewer than one in a thousand random shuffles of the labels did a difference this large appear by chance, so the result is very unlikely to be a fluke. Because the segments were randomly assigned, the citywide decline cannot explain the difference: it affected both groups equally. Professor Desjardins points out that this is exactly why random assignment is the gold standard, and that a service of Port Ardent's size was able to run a level 5 study with nothing more than a spreadsheet, a random number generator and the cooperation of its patrol sergeants.
Writing a crime problem analysis
Each student's capstone report follows the same structure. It describes a specific problem rather than a broad category: not violence in Port Ardent, but assaults outside two bars on Main Street on weekend nights. It measures the problem with more than one source, using police data, calls for service and, where possible, other sources such as hospital or business records, and it notes the limits of each. It explains the problem with the theories that fit best, usually more than one. It proposes responses linked to that explanation and to evidence about what works. And it says how success will be measured, including what would count as displacement or diffusion.
| Section | Questions to answer |
|---|---|
| Problem statement | What exactly is the problem, where and when does it happen, and who is harmed? |
| Measurement | What do police records, calls and other sources show? What might they miss? |
| Explanation | Which theories best explain the pattern? What does the problem analysis triangle show? |
| Responses | What responses address the causes? What evidence supports them? Who are the partners? |
| Assessment | How will success be measured? Compared with what? How will displacement be checked? |
Amara Okafor's report is the one the professor uses as a model. She chose assaults in the Main Street bar district between 11 p.m. and 3 a.m. on Fridays and Saturdays, where police recorded 64 assaults in 2025 and the hospital emergency department treated a larger number of assault injuries from the same area, suggesting that many were never reported. Her analysis drew on routine activity theory: two large bars close at the same time, releasing several hundred people, many intoxicated, onto one block with a single taxi stand and no late-night food. Using the triangle, she identified place managers, the bar owners, as the key controllers. She proposed staggered closing times, a second taxi and ride-share pickup zone, server training to reduce overserving, better lighting and short Koper-curve patrol visits around closing. She planned to measure assaults recorded by police and hospital visits for the twelve months before and after, with a nearby entertainment area as a comparison.
The other reports cover different problems. Priya Sandhu analysed a wave of telephone scams aimed at older residents and proposed working with banks to flag unusual withdrawals, a pattern she knew from her old job. Marco DiSanto examined repeat domestic violence calls to the same addresses and proposed a coordinated response with victim services, drawing on lesson 10's evidence on repeat victimization. Jesse Morningstar wrote about youth vandalism in Nimkii Bay and proposed a land-based program designed with elders, alongside better lighting around the community centre. Linh Tran mapped the near-repeat pattern of vehicle thefts in two residential zones and proposed rapid notification of neighbours after each theft.
Revisiting first beliefs
Professor Desjardins hands back the cards from the first class. Amara wrote that most crime is committed by a few people. She keeps it, with a correction: a small group of persistent offenders does commit a large share of serious crime, but most people who offend do so briefly in adolescence and stop. Marco wrote that harsher punishment deters crime. He now writes that certainty deters much more than severity, and that early childhood programs prevent crime better than either. Priya wrote that crime is driven by opportunity. She keeps it, adding that opportunity explains when and where crime happens but not why some people take opportunities and others do not.
Jesse wrote that the justice system is unfair to Indigenous people. He keeps it too, now able to cite the evidence on overrepresentation, the history in conflict and critical theories, and the Gladue principles designed to address it. He adds that the same communities bear a heavy share of victimization, so better policing for them means both fairer treatment and better protection. Linh wrote that we cannot know how much crime there really is. She revises it: we cannot know exactly, but by combining police data, victim surveys and other sources we can estimate it well enough to act, and we can be honest about the uncertainty. The professor says that this is what he hoped for. None of them abandoned their beliefs, but all of them now hold those beliefs in a form that evidence can test.
The course ends with a reminder of why criminology matters for a career in policing. Officers deal every day with the outcomes that criminologists study: the young people at the peak of the age-crime curve, the hot spots that generate most calls, the victims who are likely to be harmed again and the programs that may or may not help. An officer who understands those patterns can make better decisions on the street and better arguments in the office. The next courses in the program turn from understanding crime to the law, procedures and skills that officers use to respond to it.
Worked problem
Choosing the stronger evaluation
Two proposals to evaluate Amara's bar district plan are on the table. Plan A counts assaults in the bar district for one year before and one year after the changes. Plan B does the same, but also counts assaults in a similar entertainment district on the other side of the city that will not receive the changes. Which is stronger, and why?
Show solution
- Place each plan on the Maryland scale: plan A is level 2 (before and after, no comparison); plan B is level 3 (before and after with a comparison area).
- Identify a rival explanation that plan A cannot rule out: assaults might fall citywide because of a general decline, a new bylaw or a cold winter.
- See how plan B deals with it: if the comparison district shows a similar fall, the change was probably not caused by the plan; if the bar district falls much more, the plan is the more likely cause.
- Consider what would make it stronger still: add a buffer zone around the bar district to check for displacement, and use hospital data as a second measure.
Answer: Plan B is stronger because the comparison district helps rule out citywide changes as the cause. Adding a buffer zone and a second data source would strengthen it further. Random assignment would be stronger again, but with only one bar district in the city, a level 3 design with careful measurement is a realistic and useful choice.
Common mistakes
MistakeEvidence-based policing means officers must wait for research before acting.
InsteadIt means using the best available evidence to guide deployment, programs and practices, while officers still use judgement and training on individual calls.
MistakeA fall in crime after a program proves the program worked.
InsteadCrime may have fallen for other reasons; a comparison area, or better still random assignment, is needed to rule out rival explanations.
MistakeHot spots policing means saturating an area with officers for hours.
InsteadShort, unpredictable visits of about 15 minutes and problem solving at the hot spot are generally more efficient.
MistakeA problem analysis should describe a broad crime category.
InsteadIt should define a specific problem in a specific place and time, so that causes can be identified and responses targeted.
Summary and key terms
- Evidence-based policing uses research to target resources, test methods and track results.
- The Maryland Scientific Methods Scale ranks evaluations from simple correlations (level 1) to randomized experiments (level 5).
- The SARA model, scanning, analysis, response and assessment, structures problem-oriented policing.
- Hot spots policing has strong evidence; short visits of about 15 minutes follow the Koper curve.
- Random assignment lets even a small service test whether a practice works, as the Port Ardent trial showed.
- A crime problem analysis defines a specific problem, measures it with several sources, explains it with theory, proposes evidence-based responses and plans an assessment.
- Evidence-based policing
- An approach in which police practices are guided and tested by research on what works.
- Maryland Scientific Methods Scale
- A five-level ranking of the strength of evidence from evaluations.
- Randomized experiment
- A study in which people or places are randomly assigned to receive a program or not.
- SARA model
- The problem-solving cycle of scanning, analysis, response and assessment.
- Koper curve
- The finding that police presence at a hot spot deters crime best when it lasts about 15 minutes.
- Permutation test
- A test that estimates how often a result could arise by chance by repeatedly shuffling group labels.
Practice problems
Work each problem on paper first, then reveal the answer to check.
What three words did Sherman use to summarize evidence-based policing?
Show answer
Targeting, testing and tracking.
A study compares crime in a neighbourhood with cameras to crime in one without, at a single point in time. What level is it on the Maryland scale?
Show answer
Level 1: a correlation at one point in time.
Put the four stages of SARA in order.
Show answer
Scanning, analysis, response, assessment.
Why can random assignment rule out a citywide crime decline as an explanation?
Show answer
Because random assignment makes both groups alike on average, so a citywide decline affects both equally and cannot explain a difference between them.
Name the five sections of a crime problem analysis.
Show answer
Problem statement, measurement, explanation, responses and assessment.
Lesson quiz · 5 questions
Score 60% or more to complete this lesson.
Create a free account to save your progress, take quizzes and earn a certificate.