
LES-102 · Lesson 9 of 12 · 20 min
Patterns of crime: age, gender, place and time
▶ Video coming soon A video version of this lesson is on the way.
Linh Tran has been looking forward to this lesson since the first class. Theories, she says, are only as good as the facts they explain, and criminology has a small set of facts so consistent that every theory has to account for them. Professor Desjardins agrees. Crime is not spread randomly across people, places or times. It is concentrated among young men, in a small number of places and at predictable hours, days and seasons, and it has risen and fallen in long waves that few people predicted. For police these patterns are not academic. They decide where officers are deployed, when shifts overlap and which problems deserve a focused effort.
The age-crime curve
The relationship between age and crime is one of the most robust findings in all of social science. In every society and period for which data exist, offending rises sharply in early adolescence, peaks in the late teens or early twenties and declines steadily afterward. The curve is steepest for crimes such as vandalism, theft and robbery, which peak earliest, and flatter for fraud, which peaks later because it requires access to money and positions of trust. In Canada, police-reported data show the rate of persons accused of crime is highest among people aged 18 to 24, and the youth crime rate for those aged 12 to 17 was 2,694 per 100,000 in 2025, down 3.8% from the year before and far below its level of the early 2000s.
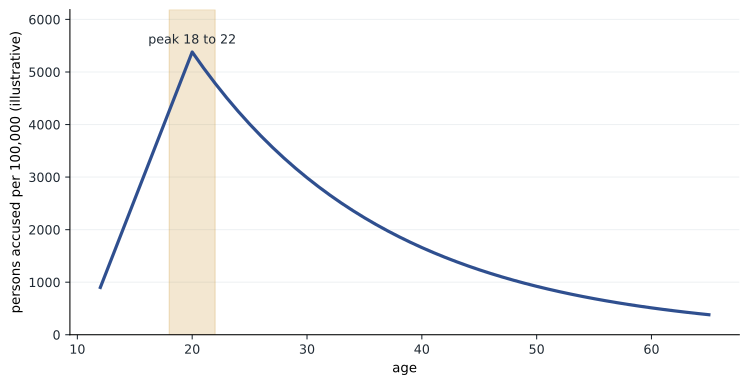
Theories you have studied explain the curve in different ways. The maturity gap and adolescent brain development explain the rise and the teenage peak. Social learning stresses the importance of peers in adolescence. Control and life-course theories explain the decline through the bonds of adulthood: work, relationships, children and the routines that come with them. Moffitt's typology explains why the curve combines a large group who offend mainly as teenagers with a small group who continue. Gottfredson and Hirschi, by contrast, argued that the curve is the same for everyone and cannot be explained by social factors at all, a claim much debated. For police, the curve means that a large share of the people they deal with are young adults, and that most will stop offending as they age if they are not pushed deeper in.
Gender and crime
The second great regularity is gender. Men commit the large majority of crimes, and the gap is widest for serious violence. In Canada, about three-quarters of persons accused of crime by police are male, and men account for roughly 90% of persons accused of homicide. Women's share is highest for offences such as shoplifting and fraud and lowest for robbery, sexual offences and homicide. When women do commit violence, it is more often against partners and family members and less often against strangers. The gender gap has narrowed somewhat over time in some offence categories, mostly minor ones, but it remains large everywhere.
Explanations draw on several perspectives. Biosocial researchers point to average differences in risk taking and physical aggression. Control theorists note that girls are typically supervised more closely than boys. Feminist scholars stress how ideas of masculinity that value toughness, dominance and risk shape men's offending, and how different pathways bring women and girls into crime. Men are also more likely to be victims of violence overall, especially violence by strangers and in public places, while women are more likely to be victims of sexual violence and violence by intimate partners. Victimization, like offending, is patterned by gender.
Crime and place
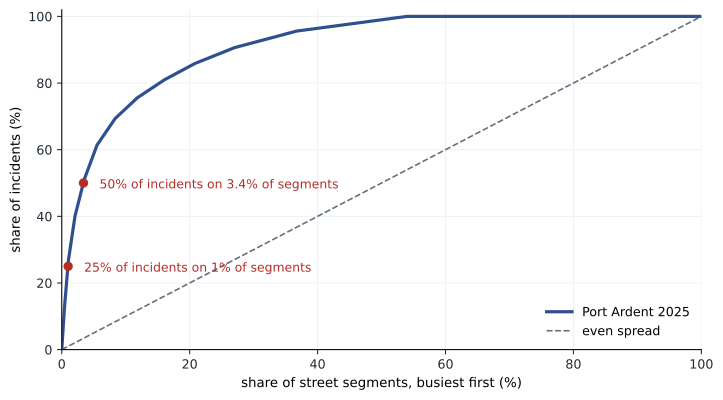
The third regularity concerns place, and it has transformed policing. In 1989 Lawrence Sherman and his colleagues studied calls to police in Minneapolis and found that about half came from just 3% of addresses. Later research by David Weisburd in Seattle, New York, Tel Aviv and many other cities found that crime is concentrated on a small share of street segments, the stretch of street between two intersections. Across cities, about 50% of crime typically occurs on roughly 4% of street segments, and about 25% on roughly 1%. Weisburd called this the law of crime concentration. The concentration is remarkably stable: the same segments stay hot year after year, even as crime rises or falls across the city.
Why are some places so much more criminogenic than others? Environmental criminologists Paul and Patricia Brantingham argued that crime occurs where the routine activity spaces of offenders, the places they live, work, shop and play and the paths between them, overlap with suitable targets. They described crime generators, places such as transit hubs and shopping centres that attract many people for legitimate reasons and so produce many opportunities, and crime attractors, places such as open drug markets and certain bars that draw people looking for criminal opportunities. Some places are risky because of how they are managed: a bar that overserves, a parking lot with no lighting or a building with an absentee landlord.
Linh maps Port Ardent's 2025 incidents onto the city's 1,450 street segments. Most segments recorded no incidents at all; a handful recorded more than a hundred. The code below sorts the segments from the busiest to the quietest and calculates how much crime the busiest segments account for.
# Port Ardent 2025: how many street segments recorded each number of incidents
table = [  # (incidents on the segment, number of segments)
    (120, 5), (90, 10), (50, 15), (30, 20), (20, 30), (11, 40),
    (7, 50), (5, 60), (4, 70), (3, 90), (2, 140), (1, 250), (0, 670),
]
segments = sum(n for _, n in table)
incidents = sum(c * n for c, n in table)
print(f"segments: {segments}, incidents: {incidents}")
cum_seg = cum_inc = 0
for c, n in table:
    cum_seg += n; cum_inc += c * n
    if c in (90, 30, 11, 4, 1):
        print(f"busiest {cum_seg:4d} segments ({cum_seg / segments:5.1%}) hold {cum_inc / incidents:5.1%} of incidents")
print(f"segments with no incidents: {670 / segments:.0%}")segments: 1450, incidents: 5620 busiest 15 segments ( 1.0%) hold 26.7% of incidents busiest 50 segments ( 3.4%) hold 50.7% of incidents busiest 120 segments ( 8.3%) hold 69.2% of incidents busiest 300 segments (20.7%) hold 85.8% of incidents busiest 780 segments (53.8%) hold 100.0% of incidents segments with no incidents: 46%
Port Ardent fits the law of crime concentration closely. The busiest 15 segments, about 1% of the total, account for about a quarter of all incidents; the busiest 50, about 3.4%, account for half; and almost half of all segments recorded no crime at all. The zone-level map from lesson 6 hid this. Even in zone 1, the highest-crime zone, most streets are quiet, and the crime is concentrated on a few blocks around the bus terminal, two bars and a rooming house. Focusing on those blocks is far more efficient than spreading patrols across the whole zone, which is the idea behind hot spots policing.
Crime and time
Crime also follows the clock and the calendar. Assaults and disturbances rise sharply in the evening, peak around bar closing time on Friday and Saturday nights and fall to their lowest levels in the early morning hours after 5 a.m. Residential break-ins happen most often on weekday daytimes, when homes are empty, while commercial break-ins happen mostly at night, when businesses are closed. Thefts from vehicles cluster at night in residential streets and in the daytime in commuter parking lots. Many offences, especially assaults and disorder, rise in summer, when people spend more time outdoors and in public places. Domestic violence calls rise around holidays and major sporting events.
These temporal patterns follow from routine activity theory, which you will study in the next lesson: crime happens when offenders and targets come together in the absence of capable guardians, and daily and seasonal routines decide when that happens. They matter greatly for staffing. Port Ardent's shift schedule, which you studied in the first course, sets higher night-shift minimums because calls for disorder and violence peak at night. Professor Desjardins says that the single most useful chart in a police service is often a simple table of incidents by hour and day of week, because it shows where officers are needed and when.
| Offence | Peak time | Main reason |
|---|---|---|
| Assault and disorder | Friday and Saturday, 10 p.m. to 3 a.m.; summer | Crowds, alcohol and bar closing |
| Residential break-in | Weekdays, 10 a.m. to 4 p.m. | Homes empty while people work or study |
| Commercial break-in | Overnight, weekends | Businesses closed and streets quiet |
| Theft from vehicles | Overnight in residential streets | Vehicles parked unattended in the dark |
| Domestic violence | Evenings, weekends, holidays | Time at home together, alcohol, stress |
Patterns in online and financial crime
Online crime breaks some of these patterns and follows others. Fraud, extortion and the sharing of intimate images do not need the offender and victim to be in the same place, so street-segment maps and patrol schedules do not capture them. A scammer in another country can target thousands of Port Ardent residents in an afternoon. Even so, criminologists find familiar regularities. Victimization is concentrated: a small share of people, often older adults targeted by romance and investment scams or young people targeted by sextortion, suffer repeated attacks. Offending is concentrated too, in organized groups that run fraud as a business. And timing still matters: scam calls and messages spike around tax deadlines, holidays and major news events, when people expect messages from governments, delivery companies and charities.
The Canadian Anti-Fraud Centre, run jointly by the RCMP, the Competition Bureau and the Ontario Provincial Police, estimates that only a small share of fraud victims report to it or to police, so recorded fraud greatly understates the problem. Priya notes that her bank's internal data showed the same pattern as police data on street crime: a few accounts, merchants and devices accounted for most of the losses, which is why banks, like police, focus their attention on concentrated risk. For police services, online crime raises a practical question about deployment, since the officers best placed to respond may be analysts and investigators working with banks and platforms, not patrol officers on the street.
Long-term trends: the great crime decline
Crime rates also move in long waves. In both countries, police-reported crime rose steeply from the early 1960s to a peak around 1991, then fell for more than two decades. The national crime rate fell by roughly half between 1991 and 2014, and the Crime Severity Index fell by about a third. Crime rose again between 2015 and 2022, driven partly by fraud, shoplifting, extortion and violent offences, before falling in 2024 and 2025. Similar declines occurred in many other high-income countries in the 1990s and 2000s, which suggests that causes specific to one country cannot be the whole explanation.
Criminologists still debate the causes of the great crime decline. Candidate explanations include better security, such as vehicle immobilizers and home alarms, which made common property crimes harder, an idea called the security hypothesis; the ageing of the population; changes in policing, including hot spots and problem-oriented strategies; the decline of crack cocaine markets; economic growth; the removal of lead from gasoline; increased imprisonment, mainly in the United States, though Canada's crime decline was similar without a large rise in imprisonment; and the move of young people's leisure time indoors and online. Most researchers believe several of these combined. Linh notes that the internet may also have shifted some crime rather than reduced it, since fraud and online offences have grown as traditional property crime fell.
Worked problem
Matching patterns to deployment
Port Ardent's patrol commander has two extra officers available for the summer. Assaults in zone 1 cluster on three blocks near two bars and the bus terminal, between 10 p.m. and 3 a.m. on Fridays and Saturdays. Thefts from vehicles are spread thinly across residential streets in zones 5 and 7, mostly overnight. Where and when should the officers be assigned, and why?
Show solution
- Use concentration: the assaults are tightly clustered in place and time, so a small number of officers can cover most of the risk.
- Use timing: schedule the officers for Friday and Saturday evenings from about 9 p.m. to 4 a.m., covering bar closing.
- Weigh seriousness: assaults cause injury and are more serious than thefts from vehicles.
- Consider other tools for the thefts: spread-out thefts respond better to public messages about locking cars and removing valuables than to patrols.
Answer: The two officers should be assigned to the three zone 1 blocks on Friday and Saturday nights, with visible foot patrol around bar closing, because the assaults are serious and tightly concentrated. The scattered vehicle thefts call for prevention messages and targeted follow-up rather than patrol.
Common mistakes
MistakeCrime is spread fairly evenly across a high-crime neighbourhood.
InsteadCrime is concentrated on a small share of street segments even within high-crime areas; about half of crime typically occurs on about 4% of segments.
MistakeOffending is a fixed trait that stays the same across life.
InsteadOffending rises in adolescence, peaks around ages 18 to 22 and declines through adulthood for almost everyone.
MistakeThe crime decline happened only because of more imprisonment.
InsteadCanada and other countries saw similar declines without large increases in imprisonment; better security, policing changes and other factors contributed.
MistakeWomen commit as much crime as men.
InsteadMen account for about three-quarters of people accused or arrested and about nine in ten homicide offenders.
Summary and key terms
- The age-crime curve rises in adolescence, peaks in the late teens or early twenties and declines through adulthood in every society studied.
- Men commit the large majority of crimes, especially serious violence; women's share is highest for minor property offences and fraud.
- The law of crime concentration: about half of crime typically occurs on about 4% of street segments, and the same places stay hot over time.
- Crime generators attract many people for legitimate reasons; crime attractors draw people seeking criminal opportunities.
- Crime follows predictable daily, weekly and seasonal rhythms that reflect routine activities and guide staffing.
- Crime fell sharply in both countries from the early 1990s to the mid-2010s for several combined reasons, with recent rises and declines since.
- Age-crime curve
- The pattern in which offending rises in adolescence, peaks in young adulthood and declines with age.
- Street segment
- The stretch of street between two intersections, a common unit for mapping crime.
- Law of crime concentration
- The finding that a small share of places accounts for a large share of crime in a city.
- Crime generator
- A place that attracts many people for legitimate reasons and so produces many opportunities for crime.
- Crime attractor
- A place that draws people looking for criminal opportunities.
- Security hypothesis
- The explanation of the crime decline that credits better security devices and practices.
Practice problems
Work each problem on paper first, then reveal the answer to check.
Which offences peak earliest in the age-crime curve, and which later?
Show answer
Vandalism, theft and robbery peak earliest; fraud peaks later because it needs access to money and trust.
A city has 2,000 street segments. Under the law of crime concentration, about how many hold half its crime?
Show answer
About 4%, roughly 80 segments.
When do residential break-ins usually occur, and why?
Show answer
Weekday daytimes, when homes are empty.
Name three explanations offered for the great crime decline.
Show answer
Examples: better security, changes in policing, ageing population, decline of crack markets, removal of lead, economic growth.
Lesson quiz · 5 questions
Score 60% or more to complete this lesson.
Create a free account to save your progress, take quizzes and earn a certificate.