
PMP-110 · Lesson 11 of 12 · 32 min
Models, methods and artifacts
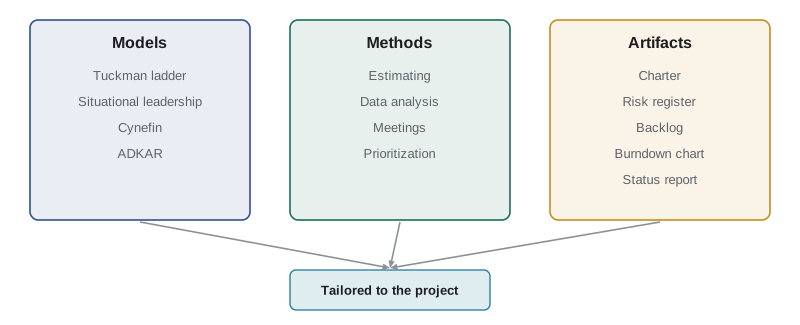
Principles tell you how to think, domains tell you what to pay attention to, and focus areas and processes tell you when work happens. But to actually do the work, project teams use specific tools: models that explain how things behave, methods that produce results, and artifacts that record information. The PMBOK Guide 7th edition grouped these into a dedicated section on models, methods and artifacts; the 8th edition describes tools and techniques alongside its processes, and PMI publishes further guidance online. This lesson gives a guided tour of the most useful items, so that when a later course or an exam question mentions one, you know what family it belongs to and what it is for.
Three kinds of tools
A model is a thinking strategy to explain a process, framework or phenomenon: for example, a model of how teams develop or how people move through change. A method is the means for achieving an outcome, output, result or deliverable: for example, a way of estimating, analysing data or running a meeting. An artifact is a template, document, output or project deliverable: for example, a risk register, a schedule or a status report. The distinction is useful because each serves a different purpose. Models help you understand and predict; methods help you do; artifacts help you record and communicate.
Commonly used models
| Category | Examples | What they help with |
|---|---|---|
| Leadership | Situational leadership, OSCAR coaching model | Adapting style to people and situations |
| Communication | Sender-receiver model, gulf of execution and evaluation | Understanding why messages are misunderstood |
| Motivation | Herzberg, Maslow, Theory X and Y, autonomy-mastery-purpose | Understanding what drives people |
| Change | Kotter's eight steps, ADKAR, Bridges' transition model, Virginia Satir model | Helping people adopt change |
| Complexity | Cynefin framework, Stacey matrix | Choosing an approach suited to uncertainty |
| Team development | Tuckman ladder, Drexler-Sibbet team performance model | Supporting teams through stages |
| Conflict and negotiation | Thomas-Kilmann modes, principled negotiation | Resolving disagreements |
| Planning and process | Salience model, Kano model, process groups | Classifying stakeholders, features and work |
Change models deserve special mention because the 2026 exam includes a Business Environment task on supporting organizational change. ADKAR, developed by Prosci, describes individual change as five outcomes: awareness of the need, desire to participate, knowledge of how to change, ability to implement and reinforcement to sustain it. Kotter's eight steps describe organizational change, from creating urgency to anchoring new approaches in the culture. Bridges distinguishes change, the external event, from transition, the internal psychological process of endings, a neutral zone and new beginnings.
Complexity models help with the choice of approach discussed in lesson 6. The Cynefin framework distinguishes clear situations (cause and effect obvious; apply best practice), complicated ones (analysis or expertise needed; apply good practice), complex ones (cause and effect visible only in hindsight; experiment, sense and respond), chaotic ones (act first to stabilize) and confusion. The Stacey matrix plots agreement about requirements against certainty about technology: high agreement and certainty suggest simple, predictable work; low agreement and certainty suggest complex or chaotic work suited to adaptive approaches.
Worked problem
Classifying a situation with Cynefin
Classify: (a) replacing light fixtures with an identical model; (b) designing a new bridge foundation on unusual soil, with expert geotechnical analysis; (c) launching a new kind of digital service in a market nobody has tried; (d) a data centre outage affecting all customers right now.
Show solution
- (a) Cause and effect are obvious: clear.
- (b) Answerable with expert analysis: complicated.
- (c) Outcomes can only be learned by trying: complex.
- (d) Urgent action needed before analysis: chaotic.
Answer: Clear, complicated, complex and chaotic. Each suggests a different response: best practice, expert analysis, experiments, and act first to stabilize.
Commonly used methods
Methods fall into broad groups. Data gathering and analysis methods include interviews, surveys, benchmarking, root cause analysis, alternatives analysis, cost-benefit analysis, earned value analysis, trend analysis and decision tree analysis. Estimating methods include analogous, parametric, bottom-up, three-point and relative estimating such as story points and planning poker. Meetings and events include kickoff meetings, planning meetings, daily stand-ups, reviews, retrospectives, steering committee meetings and lessons-learned sessions. Other methods include prioritization schemes such as MoSCoW (must have, should have, could have, won't have this time), impact mapping and timeboxing.
Worked problem
A three-point estimate
A task has an optimistic estimate of 4 days, most likely 6 days and pessimistic 14 days. Calculate the triangular and beta (PERT) estimates.
Show solution
- Triangular: \( (4 + 6 + 14) / 3 = 24 / 3 = 8 \) days.
- Beta (PERT): \( (4 + 4 \times 6 + 14) / 6 = 42 / 6 = 7 \) days.
- The pessimistic value pulls both above the most likely estimate, reflecting risk.
Answer: Triangular 8 days; beta 7 days. PMP-130 covers estimating in depth.
Worked problem
A simple decision tree
A team can build a component in-house for $80,000 with a 30 % chance of a $40,000 rework cost, or buy it for $100,000 with no rework risk. Which option has the lower expected cost?
Show solution
- Build: 80,000 + 0.30 × 40,000 = 80,000 + 12,000 = 92,000.
- Buy: 100,000.
Answer: Building has the lower expected cost ($92,000), though the organization's risk appetite and other factors such as capability may still favour buying.
Commonly used artifacts
| Category | Examples |
|---|---|
| Strategy | Business case, project brief, project charter, product vision statement, roadmap |
| Logs and registers | Assumption log, issue log, risk register, stakeholder register, lessons learned register, change log, backlog |
| Plans | Project management plan and subsidiary plans for scope, schedule, cost, quality, risk, communication, procurement and change control; release and iteration plans |
| Hierarchy charts | Work breakdown structure, organizational breakdown structure, resource breakdown structure, risk breakdown structure |
| Baselines | Scope, schedule and cost baselines; performance measurement baseline |
| Visual data and information | Gantt charts, burndown and burnup charts, cumulative flow diagrams, dashboards, information radiators, RACI charts |
| Reports | Status reports, quality reports, risk reports |
| Agreements and contracts | Contracts, service level agreements, memoranda of understanding |
Artifacts differ between approaches. Predictive projects typically maintain detailed baselines and a formal change log. Adaptive projects rely on the product backlog, iteration backlogs, burndown or burnup charts and information radiators, visible displays of progress that anyone can read. Hybrid projects combine them, for example a milestone schedule for governance and a backlog for team work.
Worked problem
Reading a burndown chart
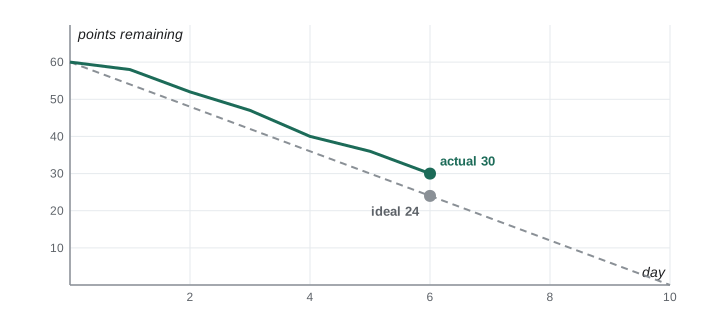
A two-week iteration starts with 60 story points. After 6 of 10 working days, 30 points remain. Is the team on track, and what remaining daily rate is needed?
Show solution
- Ideal burn rate: 60 / 10 = 6 points per day.
- Ideal remaining after 6 days: 60 − 6 × 6 = 24 points.
- Actual remaining: 30 points, so the team is 6 points behind the ideal line.
- Required rate for the last 4 days: 30 / 4 = 7.5 points per day.
Answer: Slightly behind. The team should discuss at the daily stand-up whether to adjust scope with the product owner or address an impediment.
Selecting and tailoring tools
No project uses every model, method and artifact. Over-documentation wastes effort and can hide the important information under noise; under-documentation leaves teams and stakeholders without the information they need. Selection should consider the development approach, project size and risk, stakeholder needs, regulatory requirements and organizational standards. A useful test for any artifact is: who will use it, for what decision, and how often? If nobody can answer, the artifact is a candidate for removal or simplification.
Canadian public-sector projects may be required to produce specific artifacts, such as business cases, Project Complexity and Risk Assessment results, gating documents, privacy impact assessments under federal or provincial privacy law, and, for federal services, official languages and accessibility assessments.
Artificial intelligence as a tool
The PMBOK Guide 8th edition adds guidance on using artificial intelligence in project work, including use cases, responsible use and ethics. AI tools can draft documents, summarize meetings, analyse schedules and risks, and answer questions about project data. They also raise questions of accuracy, confidentiality, bias and accountability. A sound approach treats AI output as a draft or input that a responsible person reviews, follows organizational policy on data and tools, and is transparent with stakeholders about how AI is used. The accountable leader principle applies: using a tool does not shift responsibility away from the people who rely on it.
Information radiators and transparency
An information radiator is a highly visible display of project information, such as a task board, burnup chart or risk wall, placed where the team and stakeholders can see it at a glance. Physical boards were common in co-located teams; distributed teams use shared online boards and dashboards. The idea is transparency: anyone can see the state of the work without asking for a report, which reduces status meetings and surfaces problems early. Transparency also supports trust, because stakeholders see the same information the team sees.
Worked problem
Reading a burnup chart
A release has 200 story points of scope. After five iterations the team has completed 90 points, averaging 18 per iteration. The product owner then adds 20 points of scope. At the same velocity, how many more iterations are needed?
Show solution
- New total scope: 200 + 20 = 220 points.
- Remaining: 220 − 90 = 130 points.
- Iterations needed: 130 / 18 ≈ 7.2, so about 8 iterations.
Answer: About 8 more iterations. A burnup chart makes the scope increase visible as a rise in the total-scope line, which a burndown chart can hide.
Measures that matter
Many artifacts exist to measure something. Good measures are linked to decisions, few in number and hard to game. Measures can be leading, predicting future performance (such as the number of open high risks or the trend in defect discovery), or lagging, reporting what has already happened (such as cost variance or features delivered). A balanced set includes both. Vanity metrics, which look impressive but drive no decision, waste attention. Later courses cover earned value, flow metrics and other measures in detail.
Choose a small, balanced set of measures at the start, agree who will use each one and for what decision, and review the set periodically. Dropping a measure that no longer informs decisions is as important as adding a new one.
When you meet a new tool in later courses, place it in this framework: is it a model that explains, a method that produces, or an artifact that records? Then ask what decision or understanding it supports. That habit makes long lists of tools far easier to remember and apply.
Tools also differ in cost. A burndown chart generated automatically from the team's board costs almost nothing to maintain; a weekly narrative report written by hand may cost hours. When two artifacts serve the same need, prefer the cheaper one, and automate where possible. The time saved goes back into delivering value, which is the point of every tool in this lesson.
The same thinking applies to meetings, which are methods: each should have a purpose, the right attendees and a clear output.
Common mistakes
MistakeConfusing models with methods.
InsteadModels explain; methods produce results.
MistakeProducing every artifact in the template library.
InsteadSelect those that serve a real decision or need.
MistakeUsing best practice in a complex situation.
InsteadComplex work needs experiments and feedback.
MistakeReading a burndown gap as a reason to blame.
InsteadIt is a signal to discuss scope, impediments or estimates.
MistakeTreating AI output as authoritative.
InsteadReview it and keep human accountability.
Summary and key terms
- Models explain behaviour, methods produce outcomes and artifacts record information.
- Useful models cover leadership, communication, motivation, change, complexity, teams and conflict.
- ADKAR, Kotter and Bridges help support organizational change.
- Cynefin and the Stacey matrix help match approaches to uncertainty.
- Methods include estimating, data analysis, meetings and prioritization.
- Artifacts include strategy documents, logs, plans, hierarchy charts, baselines, visuals, reports and agreements.
- Tools should be selected and tailored; AI is a tool that leaves accountability with people.
- Model
- A thinking strategy that explains a process, framework or phenomenon.
- Method
- A means of achieving an outcome, output or deliverable.
- Artifact
- A template, document, output or deliverable.
- ADKAR
- A model of individual change: awareness, desire, knowledge, ability, reinforcement.
- Cynefin framework
- A model classifying situations as clear, complicated, complex, chaotic or confused.
- Stacey matrix
- A model plotting requirement agreement against technical certainty.
- Three-point estimate
- An estimate using optimistic, most likely and pessimistic values.
- MoSCoW
- A prioritization scheme: must, should, could, won't have this time.
- Burndown chart
- A chart showing work remaining over time.
- Information radiator
- A visible display of project information for anyone to see.
Practice problems
Work each problem on paper first, then reveal the answer to check.
Is a risk register a model, method or artifact?
Show answer
An artifact.
Is planning poker a model, method or artifact?
Show answer
A method.
Name the five elements of ADKAR.
Show answer
Awareness, desire, knowledge, ability, reinforcement.
O = 2, M = 5, P = 14: beta estimate?
Show answer
6.
Which Cynefin domain suits experimentation?
Show answer
Complex.
40 points, 8 days, 20 remaining after 4 days. On track?
Show answer
Yes; ideal remaining is 20.
What does MoSCoW stand for?
Show answer
Must have, should have, could have, won't have this time.
Name two artifacts typical of adaptive projects.
Show answer
Product backlog, burndown chart, information radiator, iteration plan.
Build $50,000 with 20 % chance of $30,000 rework; buy $58,000. Lower expected cost?
Show answer
Build: $56,000.
What question tests whether an artifact is needed?
Show answer
Who will use it, for what decision and how often?
Lesson quiz · 5 questions
Score 60% or more to complete this lesson.
Create a free account to save your progress, take quizzes and earn a certificate.