
PMP-131 · Lesson 2 of 12 · 28 min
Quality control tools and continuous improvement
Lesson 1 set quality standards and metrics for Project Compass and argued for prevention over inspection. This lesson covers the tools a project uses to collect and analyse quality data, find the causes of problems and decide what to fix first: the classic seven basic quality tools, control charts, statistical sampling, an introduction to design of experiments, and improvement methods such as plan-do-check-act, Six Sigma and Lean. BUS-230 treats statistical process control and Six Sigma from an operations point of view; here the emphasis is on what a project manager needs to recognize, interpret and apply in exam scenarios.
The seven basic quality tools
Kaoru Ishikawa popularized a set of simple tools that can solve most everyday quality problems. Each answers a different question, and exam questions often describe a situation and ask which tool fits.
| Tool | Question it answers | Project Compass use |
|---|---|---|
| Cause-and-effect (Ishikawa, fishbone) diagram | What might be causing this problem? | Brainstorming causes of kiosk failures at checkout |
| Flowchart (process map) | What are the steps, decisions and hand-offs? | Mapping the tag-encoding procedure to find where errors enter |
| Check sheet (tally sheet) | How often does each type of event occur? | Recording reasons for failed gate reads during testing |
| Histogram | How is a variable distributed? | Distribution of minutes per kiosk transaction |
| Pareto chart | Which few categories account for most of the problems? | Ranking punch-list items by category |
| Scatter diagram | Is there a relationship between two variables? | Tag read failures against distance of the item from the gate |
| Control chart | Is the process stable and predictable over time? | Tags encoded per hour, shift by shift |
Some lists replace the flowchart with stratification, which means separating data by source, such as shift, supplier or location, so that patterns hidden in the totals become visible. A Compass example: the overall gate read rate looks acceptable, but stratifying by item type shows that DVDs in metal-foil cases fail far more often than books. Exam questions also mention related tools such as affinity diagrams for grouping ideas, matrix diagrams for relationships between sets of factors, and the 5 whys for drilling down to a root cause.
Finding causes: fishbone diagrams and the 5 whys
A cause-and-effect diagram places the problem, or effect, at the head of a fish and groups possible causes on bones under headings. A common set for manufacturing and operations is the six Ms: people (manpower), methods, machines, materials, measurement and environment (mother nature). Service teams sometimes use policies, procedures, people and plant. The headings are prompts; what matters is that the team considers causes broadly before choosing which to investigate.
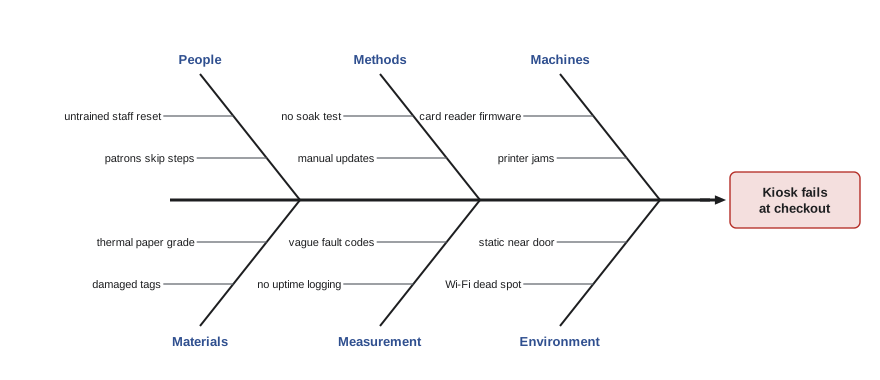
A fishbone diagram lists possible causes; it does not prove any of them. The next step is to gather data, for example from the kiosk logs and a check sheet kept by staff, to see which causes actually occur. The 5 whys technique helps drill from a symptom to a root cause by repeatedly asking why. For the pilot kiosk failures: why did the kiosk fail? The card reader stopped responding. Why? It crashed after a firmware update. Why was the update applied? The vendor pushes updates automatically. Why was that not controlled? The contract did not specify update rights or a test step. The root cause is a procurement gap, not a hardware fault, and the fix belongs in the Eastgate kiosk contract (lesson 9). Five is a rule of thumb, not a requirement.
Prioritizing: Pareto charts
A Pareto chart is a bar chart sorted in descending order of frequency (or cost), with a cumulative percentage line. It applies the Pareto principle, the observation that a small number of causes often accounts for most of the effect, sometimes stated as 80/20. The chart helps teams focus improvement effort where it will matter most.
# Pareto analysis of the fit-out punch list at Eastgate (invented counts)
defects = {"Paint touch-ups": 46, "Door hardware": 31, "Data outlets not live": 22,
           "Ceiling tiles damaged": 14, "Millwork alignment": 9, "Signage": 6,
           "Lighting controls": 5, "Flooring transitions": 4, "Other": 3}
total = sum(defects.values())
cum = 0
print(f"{'Category':24s}{'Count':>6s}{'Cum %':>8s}")
for k, v in sorted(defects.items(), key=lambda kv: -kv[1]):
    if k == "Other":
        continue
    cum += v
    print(f"{k:24s}{v:6d}{cum / total:8.0%}")
cum += defects["Other"]
print(f"{'Other':24s}{defects['Other']:6d}{cum / total:8.0%}")
top3 = sum(sorted(defects.values(), reverse=True)[:3])
print(f"Top 3 of {len(defects)} categories = {top3 / total:.0%} of {total} items")Category Count Cum % Paint touch-ups 46 33% Door hardware 31 55% Data outlets not live 22 71% Ceiling tiles damaged 14 81% Millwork alignment 9 87% Signage 6 91% Lighting controls 5 95% Flooring transitions 4 98% Other 3 100% Top 3 of 9 categories = 71% of 140 items
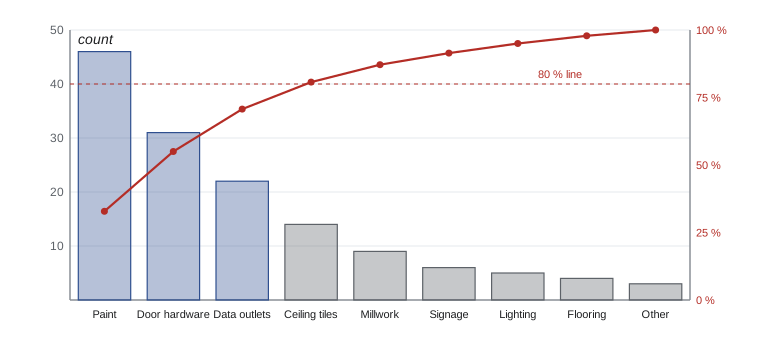
Three of nine categories account for 71 % of the 140 items, and four account for 81 %. The fit-out lead asks the contractor to assign a dedicated painter and a hardware installer for a week, and to have the data cabling subcontractor test every outlet before the next walk-through, instead of working through the list in random order. Two cautions apply. The most frequent category is not always the most important; one safety-related item, such as a missing handrail, outweighs dozens of paint touch-ups, so Pareto charts are sometimes drawn by cost or severity instead of count. And the "Other" category belongs at the right, whatever its size, so that it does not hide meaningful categories.
Control charts
A control chart shows whether a process is stable, meaning its variation comes only from common causes inherent in the process, or whether special causes are present, such as a new material batch, a broken machine or an untrained operator. The chart plots measurements over time against a centre line (the process mean) and upper and lower control limits, usually set at three standard deviations from the mean. Limits are calculated from the process's own data, which is why they differ from specification limits set by the customer.
Two kinds of signal indicate a special cause. The first is a point outside the control limits. The second is a non-random pattern inside the limits; the rule most often quoted in project management materials is the rule of seven: seven consecutive points on one side of the mean, or seven consecutive points trending up or down, suggests the process has shifted even if no single point is outside the limits. Quality practitioners use fuller rule sets (often called the Western Electric rules), but for the exam the two signals above are the essentials.
# Control chart for tags encoded per hour at the Eastgate encoding station (invented data)
import random, statistics
random.seed(131)
# 25 subgroups (one per shift) of 5 one-hour readings each
groups = []
for k in range(25):
    mu = 120 if k < 17 else 115          # a slower tag batch arrives at shift 18
    groups.append([round(random.gauss(mu, 6)) for _ in range(5)])
means = [statistics.mean(g) for g in groups]
ranges = [max(g) - min(g) for g in groups]
# Limits from the first 15 subgroups (the stable baseline period)
xbarbar = statistics.mean(means[:15]); rbar = statistics.mean(ranges[:15])
A2 = 0.577                                # constant for subgroups of 5
ucl, lcl = xbarbar + A2 * rbar, xbarbar - A2 * rbar
print(f"Mean line {xbarbar:.1f}  UCL {ucl:.1f}  LCL {lcl:.1f}  (R-bar {rbar:.1f})")
run, flags = 0, []
print('(shifts 1-12 omitted: all within limits, no runs)')
for i, m in enumerate(means, 1):
    side = 1 if m > xbarbar else -1
    run = run + side if run * side > 0 else side
    out = m > ucl or m < lcl
    seven = abs(run) >= 7
    note = "outside limits" if out else ("rule of seven" if seven else "")
    if note:
        flags.append(i)
    if i > 12:
        print(f"shift {i:2d}  mean {m:6.1f}  {note}")
print("Signals at shifts:", flags)Mean line 120.3 UCL 127.5 LCL 113.0 (R-bar 12.5) (shifts 1-12 omitted: all within limits, no runs) shift 13 mean 121.0 shift 14 mean 117.6 shift 15 mean 118.8 shift 16 mean 123.4 shift 17 mean 119.4 shift 18 mean 112.4 outside limits shift 19 mean 115.6 shift 20 mean 115.4 shift 21 mean 113.0 outside limits shift 22 mean 112.4 outside limits shift 23 mean 113.2 rule of seven shift 24 mean 110.8 outside limits shift 25 mean 117.4 rule of seven Signals at shifts: [18, 21, 22, 23, 24, 25]
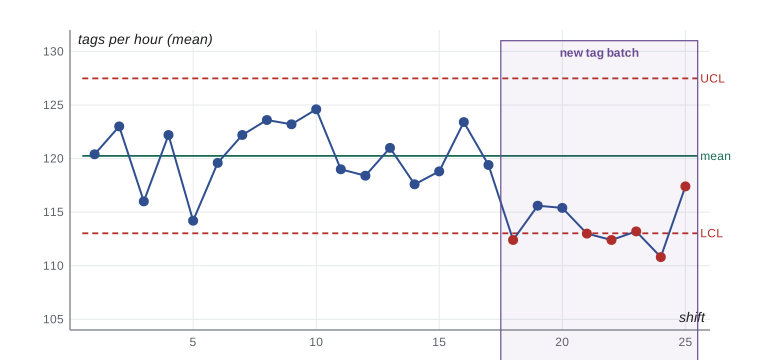
The control limits were set from the first 15 shifts, when the process was stable. At shift 18 the mean drops below the lower control limit. Shift 17 was already slightly below the mean, and every point after it stays below the mean, so the run reaches seven at shift 23 and the rule of seven fires as well. The supervisor investigates and finds that the new batch of tags has a slightly different chip that takes longer to encode with the existing software settings. That is a special cause: something changed. The response is to correct the cause (update the encoding profile with the vendor), not to tell staff to work faster. Shift 21, at exactly the lower limit, shows why judgement is needed near boundaries; the run of points below the mean is the clearer signal.
Equally important is what not to do. If a process is in control, reacting to every high or low point, which Deming called tampering, adds variation instead of removing it. And a stable process may still not be good enough: if the library needed 135 tags an hour to meet the schedule, the process would be in control but not capable, and the fix would be a change to the process itself, such as the third encoding station considered in PMP-130.
Statistical sampling and acceptance sampling
Inspecting every item is often too slow, too expensive or destructive. Statistical sampling selects part of a population for inspection and uses the results to draw conclusions about the whole. Two distinctions recur. Attribute sampling classifies each item as conforming or not (a tag reads or it does not); variable sampling measures a continuous value (encoding time in seconds). And acceptance sampling decides whether to accept a whole lot, such as a carton of tags, based on a sample.
# Acceptance sampling for incoming RFID tag cartons (single sampling plan)
from math import comb
n, c = 80, 2            # inspect 80 tags per carton of 5,000; accept if 2 or fewer fail
def p_accept(p):
    return sum(comb(n, k) * p**k * (1 - p)**(n - k) for k in range(c + 1))
print(" Defect rate   P(accept carton)")
for p in (0.005, 0.01, 0.02, 0.03, 0.05, 0.08):
    print(f"   {p:6.1%}        {p_accept(p):6.1%}")
# Supplier's contract quality level is 1 %; the library cannot tolerate more than 5 %
print(f"\nProducer's risk at 1 %: {1 - p_accept(0.01):.1%} Consumer's risk at 5 %: {p_accept(0.05):.1%}") Defect rate P(accept carton)
0.5% 99.2%
1.0% 95.3%
2.0% 78.4%
3.0% 56.8%
5.0% 23.1%
8.0% 4.0%
Producer's risk at 1 %: 4.7% Consumer's risk at 5 %: 23.1%The operating characteristic of the plan shows its trade-offs. At the supplier's contracted quality level of 1 % defective, a good carton is rejected about 4.7 % of the time; this is the producer's risk. At 5 % defective, a level the library cannot tolerate, a bad carton is still accepted about 23 % of the time; this is the consumer's risk. If that is too high, the library can inspect a larger sample, tighten the acceptance number, or, better, require the supplier to demonstrate process control so that bad cartons are rare in the first place. Sampling plans and their risks should be agreed in the contract, not invented on the loading dock.
Design of experiments and other analysis tools
Design of experiments (DOE) is a statistical method for identifying which factors influence a result and how they interact, by changing several factors systematically in a planned set of trials rather than one at a time. For the security gates, the vendor might test combinations of antenna power, gate spacing and item orientation to find settings that give the best read rate with the fewest false alarms. The exam expects you to recognize DOE as the tool for optimizing several factors efficiently, not to design experiments.
Other analysis tools include benchmarking (comparing practices or results with those of other projects or organizations to find ideas and set targets; the library could compare its kiosk uptime with that of a neighbouring library system), process analysis (studying a process to find non-value-adding steps), root cause analysis and failure mode and effects analysis (FMEA), which rates potential failure modes by severity, occurrence and detection before they happen.
Continuous improvement: PDCA, Six Sigma and Lean
The plan-do-check-act (PDCA) cycle, associated with Shewhart and Deming, is the basic improvement loop. Plan a change based on analysis, do it on a small scale, check the results against expectations, and act: adopt the change, adapt it or abandon it, then repeat. Retrospectives in agile teams follow the same logic.
| Method | Core idea | Typical structure or tools |
|---|---|---|
| PDCA | Iterative cycles of small, tested changes | Plan, do, check, act |
| Six Sigma | Reduce variation and defects using data; six sigma corresponds to about 3.4 defects per million opportunities | DMAIC: define, measure, analyse, improve, control; trained roles such as Green Belts and Black Belts |
| Lean | Maximize value by eliminating waste and improving flow | Value stream mapping, the eight wastes, pull, standard work, 5S |
| Lean Six Sigma | Combines flow and waste reduction with variation reduction | DMAIC with Lean tools |
| Total quality management | Organization-wide commitment to quality and customer satisfaction | Leadership, employee involvement, process focus |
A project usually works within its organization's quality approach rather than inventing one. The project's job is to apply the relevant tools to its own processes and deliverables, contribute improvement ideas and lessons learned, and avoid making changes to organizational processes that it has no authority to make. When a project identifies a needed change to a standard organizational process, such as the library's procurement templates, it recommends the change to the process owner.
Worked problem
Choosing the right tool
The technology lead reports three problems during the kiosk soak test: (1) the team wants to know which of eleven error codes cause most of the downtime, (2) staff suspect that failures increase with the number of transactions per hour, and (3) the transaction time has been stable for two weeks but jumped yesterday. Which tool fits each?
Show solution
- (1) Ranking error codes by downtime is a Pareto chart, drawn by minutes of downtime rather than count.
- (2) Testing whether failures rise with transaction volume calls for a scatter diagram, followed by a closer look if a pattern appears.
- (3) Judging whether a jump in a previously stable measure is a real shift calls for a control chart of transaction time.
Answer: Pareto chart for prioritizing causes, scatter diagram for a suspected relationship and control chart for stability over time.
Common mistakes
MistakeTreating every point near a control limit as a problem to fix.
InsteadReact to special-cause signals, such as points outside the limits or a run of seven; avoid tampering with a stable process.
MistakeSetting control limits equal to the customer's specification.
InsteadCalculate control limits from process data; compare them with specifications to judge capability.
MistakeUsing a fishbone diagram as proof of the cause.
InsteadUse it to generate hypotheses, then confirm causes with data.
MistakeAlways fixing the most frequent category first.
InsteadConsider severity and cost; draw the Pareto chart by impact when that matters more than count.
MistakeInspecting every item when a sampling plan would do.
InsteadUse statistical sampling with agreed producer's and consumer's risks.
Summary and key terms
- The seven basic tools: cause-and-effect diagram, flowchart, check sheet, histogram, Pareto chart, scatter diagram and control chart.
- Fishbone diagrams and the 5 whys generate and drill into possible causes; data confirms them.
- Pareto charts rank categories so effort goes where it matters most.
- Control charts separate common-cause variation from special causes: points outside limits or a run of seven.
- Sampling inspects part of a population; acceptance plans balance producer's and consumer's risk.
- Design of experiments optimizes several factors at once.
- PDCA, Six Sigma (DMAIC) and Lean drive continuous improvement.
- Control chart
- A graph of process data over time with a centre line and calculated control limits.
- Special cause
- A source of variation that is not part of the normal process and can be identified and removed.
- Common cause
- Random variation inherent in a stable process.
- Rule of seven
- A heuristic that seven consecutive points on one side of the mean suggest a process shift.
- Pareto chart
- A sorted bar chart with a cumulative line, used to identify the vital few causes.
- Cause-and-effect diagram
- A fishbone-shaped diagram that groups possible causes of a problem.
- Acceptance sampling
- Accepting or rejecting a lot based on inspection of a sample.
- Design of experiments
- A statistical method for determining which factors influence outcomes, by varying them systematically.
- DMAIC
- The Six Sigma improvement cycle: define, measure, analyse, improve, control.
Practice problems
Work each problem on paper first, then reveal the answer to check.
Which tool shows whether a process is stable over time?
Show answer
A control chart.
Seven consecutive points fall above the mean, all inside the limits. Is there a signal?
Show answer
Yes: the rule of seven suggests a shift.
Which tool ranks problem categories by frequency?
Show answer
A Pareto chart.
Which tool tests for a relationship between two variables?
Show answer
A scatter diagram.
What is tampering?
Show answer
Adjusting a stable process in response to common-cause variation, which adds variation.
In acceptance sampling, what is the producer's risk?
Show answer
The chance of rejecting a good lot.
Name the five DMAIC steps.
Show answer
Define, measure, analyse, improve, control.
What does the 5 whys technique aim to find?
Show answer
The root cause behind a symptom.
Which tool helps optimize several factors at once?
Show answer
Design of experiments.
A process is in control but outside tolerance. What does that mean?
Show answer
It is stable but not capable; the process itself must change.
Lesson quiz · 5 questions
Score 60% or more to complete this lesson.
Create a free account to save your progress, take quizzes and earn a certificate.