
ROB-100 · Lesson 9 of 12 · 25 min
Robots in industry, health, homes and the field
Robots now work in a remarkable range of settings. Car plants and electronics factories have used them for decades; warehouses and logistics centres have adopted them rapidly since the 2010s; hospitals use them for surgery, pharmacy and delivery; farms use them to milk cows and weed fields; homes have robot vacuums and lawn mowers; and robots inspect pipelines, power plants, mines, bridges and the ocean floor. Each setting has its own demands for precision, safety, cost and reliability, and its own reasons for using robots. This lesson surveys the main application areas, using the latest available statistics from the International Federation of Robotics (IFR), and shows how organizations decide whether a robot is worth buying, with a worked payback calculation. Figures are given at the time of writing (October 2026) and change every year.
Industrial robots in numbers
The IFR's World Robotics 2025 report, covering 2024, counted 542,000 new industrial robots installed worldwide, the fourth year in a row above half a million, and an operational stock of about 4.66 million robots, up 9 % from the year before. Asia accounted for about three-quarters of new installations, Europe for about 16 % and the Americas for about 9 %. China alone installed about 295,000 robots, 54 % of the world total, followed by Japan with about 44,500, the United States with about 34,200, South Korea with about 30,600 and Germany with about 27,000. The IFR expected installations to grow to about 575,000 in 2025 and to pass 700,000 a year by 2028.
In North America, the IFR counted about 34,200 installations in the United States in 2024, down 9 % from 2023, with an operational stock of about 393,700 robots, while Canada installed about 3,800 robots, down 12 %, with the automotive industry accounting for almost half of Canadian installations. Canada's car-assembly and parts plants, concentrated in southern Ontario, are its largest robot users, followed by metal products, plastics, food and electronics. Federal and provincial programs, such as Next Generation Manufacturing Canada (NGen), co-fund advanced manufacturing projects that often include robots.
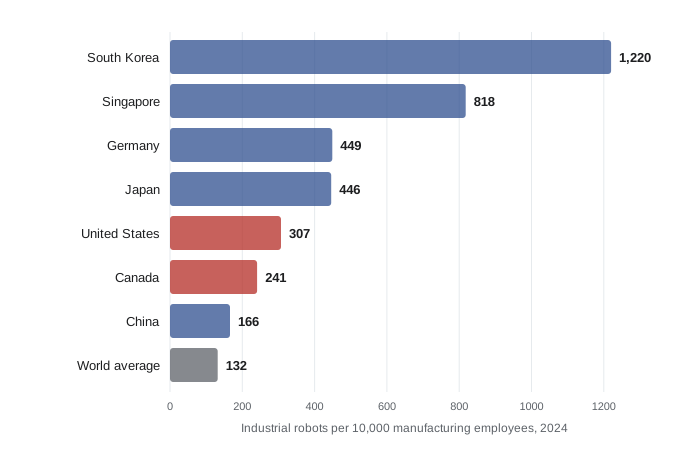
Robot density, the number of industrial robots per 10,000 manufacturing employees, allows fair comparison between countries of different sizes. For 2024, the IFR reported a world average of 132. South Korea led with 1,220, followed by Singapore with 818, Germany with 449 and Japan with 446. The United States reached 307 and Canada 241, while China, with its huge manufacturing workforce, reached 166 even though it installs by far the most robots.
Manufacturing applications
In factories, robots handle a familiar set of tasks. Handling and machine tending, loading and unloading machines, packing and palletizing, is the largest application. Welding, especially spot welding of car bodies and arc welding of steel structures, was the first big robot application and remains major. Assembly and disassembly use precise arms such as SCARAs, often in electronics. Dispensing and painting, including painting car bodies in sealed booths, protect workers from fumes and give consistent finishes. Processing tasks include grinding, polishing, deburring and cutting. Robots increasingly carry cameras for inspection and to find parts that are not precisely positioned, and collaborative applications let robots work alongside people, for example handing parts to an assembler or tending a machine in a small shop. Small and medium-sized manufacturers, once put off by the cost and complexity of robots, are adopting them faster as prices fall, programming becomes easier and labour becomes harder to find.
Logistics and warehouses
Warehousing is the fastest-growing area for professional service robots. Goods-to-person systems use fleets of mobile robots that bring shelves or totes to stationary pickers, as Amazon's robots, descended from Kiva Systems, do across its fulfilment network. Autonomous mobile robots (AMRs) navigate with lidar and cameras without fixed tracks, moving carts, pallets and totes between areas, while older automated guided vehicles (AGVs) follow wires, magnetic tape or markers. Robotic arms with vision and suction grippers pick mixed items from bins, a task long considered extremely hard because of the variety of shapes and materials, and robots unload boxes from trucks. Outdoors, small sidewalk delivery robots carry food and parcels in some cities and campuses, and delivery drones serve some communities. Humanoid robots are being piloted to move totes in warehouses. The drivers are online shopping, labour shortages and the need to process orders quickly around the clock.
Health care
Robot-assisted surgery is the best-known medical application. In systems such as Intuitive's da Vinci, the surgeon sits at a console and controls instruments held by robotic arms through small incisions; the robot scales down the surgeon's movements and filters out tremor, and the surgeon sees a magnified three-dimensional view. The robot does not operate on its own: the surgeon is in control at every moment, so these are teleoperated systems with assistance. Robotic systems are also used in orthopaedic surgery to cut bone precisely for knee and hip replacements, and in neurosurgery. Canada contributed neuroArm, an MRI-compatible surgical robot developed at the University of Calgary with MDA, the company behind Canadarm, which performed its first surgery in 2008. Beyond surgery, robots dispense medications in hospital pharmacies, deliver supplies and linens through hospital corridors, disinfect rooms with ultraviolet light, help patients relearn movements in rehabilitation, and power exoskeletons that help some people with spinal cord injuries to stand and walk. Medical robots are regulated as medical devices, by Health Canada in Canada and by the Food and Drug Administration (FDA) in the United States.
Homes and consumer robots
Robot vacuum cleaners are the most common robots in homes. Early models bounced around randomly; modern ones use lidar or cameras to map rooms, clean systematically, avoid cords and pet messes, and empty their own bins at a dock. Robot lawn mowers, pool cleaners and window cleaners follow similar principles. Educational robot kits introduce children and students to programming and engineering, and robot competitions such as FIRST Robotics and VEX involve hundreds of thousands of students across North America. Social and companion robots, which talk, respond to emotions and remind people of appointments, are being tested to support older adults, though their benefits and the privacy implications of having cameras and microphones in the home are still debated. General-purpose household robots that can tidy, cook and do laundry remain a research goal; homes are cluttered, varied and full of soft and fragile objects, which makes them one of the hardest environments for robots.
The field: agriculture, mining, energy, construction and beyond
Field robotics means robots working outdoors and in unstructured environments. In agriculture, robotic milking systems let cows choose when to be milked, and are widely used on dairy farms in Canada, the United States and Europe. Self-driving tractors and sprayers use precise satellite positioning; weeding robots use cameras to tell crops from weeds and remove weeds mechanically or with tiny doses of herbicide or lasers; and harvesting robots for delicate fruit such as strawberries and apples are being developed and introduced. Mining uses autonomous haul trucks and drills, operated from control rooms, at large mines in Canada, the United States and Australia, keeping workers away from hazardous areas. Energy companies use robots and drones to inspect power lines, wind turbines, pipelines and storage tanks, and nuclear operators use remotely operated tools to inspect and maintain reactors. In construction, robots lay bricks, tie rebar, drill ceilings and print structures in concrete, and quadrupeds carrying scanners record site progress. Underwater vehicles inspect ship hulls, pipelines and offshore platforms, and public safety agencies use drones and ground robots for search and rescue and bomb disposal.
| Sector | Typical robots | Main reasons |
|---|---|---|
| Automotive | Articulated arms for welding, painting, handling | Precision, speed, consistency |
| Electronics | SCARA and delta arms for assembly | Small parts, high throughput |
| Logistics | AMRs, goods-to-person, piece picking | E-commerce volume, labour shortages |
| Health care | Surgical systems, pharmacy, delivery, rehabilitation | Precision, minimally invasive surgery |
| Homes | Vacuums, mowers, educational kits | Convenience, learning |
| Agriculture | Milking robots, autonomous tractors, weeders | Labour, precision, reduced chemicals |
| Mining and energy | Autonomous trucks, inspection robots, drones | Safety, remote and hazardous sites |
Is a robot worth it? Payback and return on investment
Organizations decide whether to buy robots through business cases that compare costs with benefits. The full cost of a robot application is usually several times the price of the robot itself: grippers and tooling, safety equipment such as fences, light curtains and scanners, conveyors and fixtures, engineering and programming by an integrator, installation, training and disruption during start-up, followed by ongoing maintenance, energy, spare parts and software support. Benefits include labour savings, higher output, better and more consistent quality with less scrap, fewer injuries and the ability to run extra shifts. Simple payback, the investment divided by the yearly net savings, is the most common first test; many manufacturers look for payback within two or three years. Return on investment (ROI) expresses net gain as a percentage of the investment, and more careful analyses account for the time value of money. Some benefits, such as reducing injuries or staying in business when workers cannot be hired, are hard to put in dollars but often matter most.
Worked problem
Payback on a palletizing cell
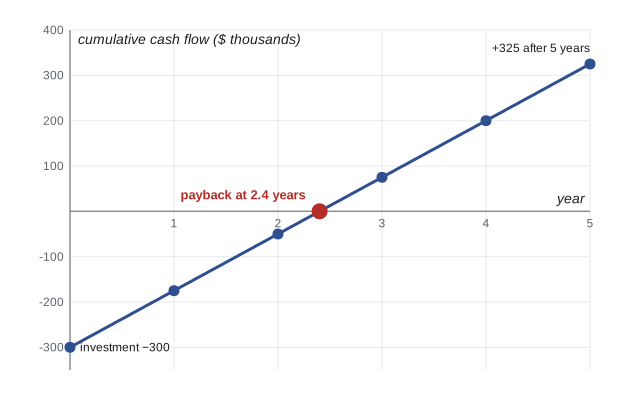
A food plant is considering a robot palletizing cell costing $180,000 for the robot, gripper and controller, plus $120,000 for safety equipment, conveyors and integration. It would replace work currently costing $65,000 a year per shift on two shifts, reassigning those workers to other jobs, and cut injury-related costs by $10,000 a year. Maintenance, energy and support would cost $15,000 a year. Find the simple payback period and the five-year ROI, ignoring the time value of money.
Show solution
- Total investment: \( 180{,}000 + 120{,}000 = \$300{,}000 \).
- Annual savings: \( 2 \times 65{,}000 + 10{,}000 = \$140{,}000 \).
- Net annual savings: \( 140{,}000 - 15{,}000 = \$125{,}000 \).
- Payback: \( 300{,}000 / 125{,}000 = 2.4 \) years.
- Five-year net benefit: \( 5 \times 125{,}000 = \$625{,}000 \); ROI \( = (625{,}000 - 300{,}000) / 300{,}000 \approx 108 \) %.
Answer: Payback in 2.4 years and a five-year ROI of about 108 %, before discounting and any tax incentives.
Canadian businesses can often reduce the after-tax cost of robots and other manufacturing equipment through capital cost allowance rules, including accelerated write-offs for manufacturing and processing machinery, and through programs such as NGen and regional development agencies. These rules change and depend on circumstances, so a business case should be checked with an accountant. The labour savings in a business case should also account for retraining and redeploying workers, which many employers, unions and governments now treat as part of any automation project.
Public services and research Robots also serve the public sector and science. Police and fire services use ground robots to inspect suspicious packages and drones to search for missing people and assess fires and floods. Municipal utilities send crawler robots with cameras through sewer and water pipes to find cracks and blockages without digging. Transportation agencies use drones to inspect bridges and roads. Scientists use robots in laboratories to run thousands of experiments automatically, handling samples for drug discovery and materials research, and use autonomous gliders and floats to measure ocean temperature and salinity across the globe. Space agencies, including the Canadian Space Agency and NASA, rely on robotic arms, rovers and landers for missions that people cannot yet undertake.
Common mistakes
MistakePricing a robot application at the cost of the robot alone.
InsteadInclude tooling, safety, integration, training and running costs.
MistakeComparing countries by total robot numbers only.
InsteadUse robot density to compare countries fairly.
MistakeDescribing surgical robots as operating on their own.
InsteadRecognize that the surgeon controls today's systems throughout.
MistakeAssuming homes are an easy place for robots.
InsteadRemember that clutter, variety and soft objects make homes very hard.
MistakeTreating statistics as permanent.
InsteadDate every figure and check the latest IFR and government data.
Summary and key terms
- About 542,000 industrial robots were installed worldwide in 2024, with an operational stock of about 4.66 million.
- China installs over half the world's robots; Korea has the highest robot density.
- The United States installed about 34,200 robots and Canada about 3,800 in 2024.
- Manufacturing robots handle, weld, assemble, paint and process; logistics robots move and pick goods.
- Surgical robots extend surgeons' skills; hospitals also use robots for pharmacy and delivery.
- Field robots work in agriculture, mining, energy, construction and underwater.
- Payback and ROI compare a robot's full costs with its savings and other benefits.
- Operational stock
- The number of industrial robots in use.
- Robot density
- Industrial robots per 10,000 manufacturing employees.
- Machine tending
- Loading and unloading parts from machines.
- Palletizing
- Stacking goods onto pallets.
- AMR
- An autonomous mobile robot that navigates without fixed tracks.
- AGV
- An automated guided vehicle that follows fixed paths or markers.
- Goods-to-person
- A system in which robots bring items to stationary workers.
- Robot-assisted surgery
- Surgery in which a surgeon controls robotic instruments.
- Field robotics
- Robots working outdoors and in unstructured environments.
- Simple payback
- Investment divided by annual net savings.
Practice problems
Work each problem on paper first, then reveal the answer to check.
How many industrial robots were installed worldwide in 2024?
Show answer
About 542,000.
Which country installed the most robots in 2024?
Show answer
China, about 295,000.
What does robot density measure?
Show answer
Industrial robots per 10,000 manufacturing employees.
US and Canadian robot density in 2024?
Show answer
United States 307, Canada 241.
What is the largest manufacturing application of robots?
Show answer
Handling and machine tending.
How does an AMR differ from an AGV?
Show answer
An AMR navigates freely; an AGV follows fixed paths or markers.
Who controls a da Vinci surgical robot?
Show answer
The surgeon, at a console.
Name two field robotics applications.
Show answer
Milking, autonomous tractors, mining trucks, inspection drones, underwater vehicles.
Investment $200,000, net savings $80,000 a year. Payback?
Show answer
2.5 years.
Investment $100,000, five-year net benefit $250,000. ROI?
Show answer
150 %.
Lesson quiz · 5 questions
Score 60% or more to complete this lesson.
Create a free account to save your progress, take quizzes and earn a certificate.