
SLS-214 · Lesson 12 of 12 · 24 min
Case study: diagnosing a missed quarter
▶ Video coming soon A video version of this lesson is on the way.
The last Friday session, on November 13, was a working meeting. Rob had asked Grace for a written diagnosis of the third quarter, June to August 2026, when the team booked 591,000 dollars against a quota of 750,000, and a plan to make sure the first quarter of fiscal 2027 did not repeat it. Grace asked Maya to help. "You weren't here in the summer," Grace said, "which makes you the right person to check whether my story is supported by the numbers or just by what people remember."
This lesson works through the diagnosis step by step, using the measures from the whole course. The method is general: start with the size of the gap, break it into parts, trace each part to its causes, check each cause against data, and turn the confirmed causes into a plan with measures that will show whether it is working.
Step 1: size the gap
The gap can be measured against quota or against the previous quarter. Grace used both.
Worked problem
Two ways to measure the gap
The team booked 591,000 dollars in the third quarter against a quota of 750,000. In the second quarter it booked 744,000. Calculate the gap against quota and against the second quarter.
Show solution
- Against quota.
- \[750{,}000 - 591{,}000 = 159{,}000 \text{ dollars}\]
- \[\frac{591{,}000}{750{,}000} = 0.788\]
- Against the second quarter.
- \[744{,}000 - 591{,}000 = 153{,}000 \text{ dollars}\]
Answer: The team was 159,000 dollars short of quota, at about 78.8 in 100, and 153,000 dollars below the second quarter.
Comparing with the second quarter is useful because it holds the team and the process roughly constant: the same five account executives, the same products and prices. Whatever changed between the quarters is where to look.
Step 2: break the gap into parts
Bookings are the number of wins multiplied by the average deal size. A change in bookings can therefore be split into a part caused by winning fewer deals and a part caused by smaller deals.
Worked problem
Wins and deal size
In the second quarter the team won 34 deals for 744,000 dollars; in the third, 30 deals for 591,000 dollars. Split the 153,000-dollar drop into the effect of fewer wins, valued at the second-quarter average deal, and the effect of smaller deals, applied to the third-quarter wins.
Show solution
- Average deal sizes.
- \[\frac{744{,}000}{34} \approx 21{,}882 \qquad \frac{591{,}000}{30} = 19{,}700\]
- Effect of fewer wins.
- \[(30 - 34) \times 21{,}882 \approx -87{,}500\]
- Effect of smaller deals.
- \[30 \times (19{,}700 - 21{,}882) \approx -65{,}500\]
- Check.
- \[-87{,}500 - 65{,}500 = -153{,}000\]
Answer: About 87,500 dollars of the drop came from winning four fewer deals and about 65,500 dollars from smaller deals. The two together account for the whole 153,000 dollars.
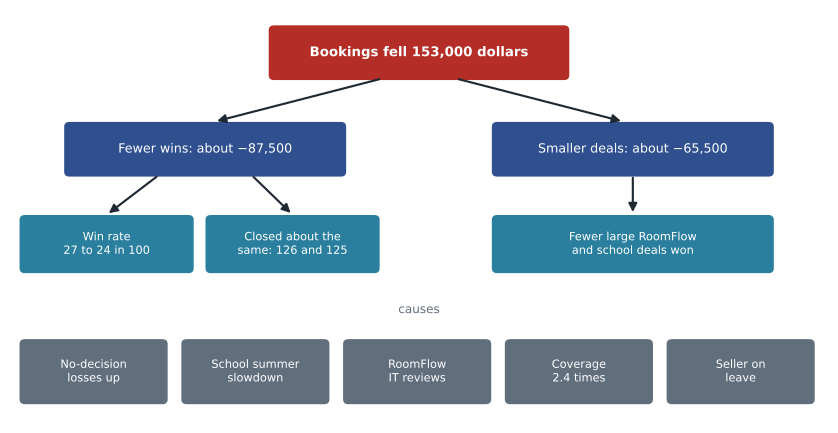
This is a driver tree: a diagram that breaks an outcome into the factors that multiply or add to produce it. Grace extended the tree one more level using the velocity terms from lesson 4.
Step 3: trace each part
Fewer wins. The team closed almost the same number of opportunities in the two quarters, 126 and 125, so the fall in wins came from the win rate, which dropped from 27 to 24 in 100. Lesson 5 showed where the losses went: 38 of the 95 third-quarter losses were no decision, against 26 in the second quarter, and school opportunities were won only about 16 in 100 of the time.
Smaller deals. The deals that disappeared from the wins were mostly large ones. RoomFlow and video-room deals, which are larger than average, had a median cycle of 84 days in the third quarter because customers' IT teams were taking longer to approve cloud software. Several that might have closed in the summer slipped into the fall. School division deals, also large, stalled over the summer.
Grace then looked at two causes upstream of the quarter itself.
Worked problem
Coverage at the start of the quarter
On June 1, the team's first-year pipeline with close dates in the third quarter was 1,800,000 dollars. On March 1 the equivalent figure for the second quarter had been 2,250,000 dollars. The quota was 750,000 dollars in both quarters. Calculate the coverage at the start of each quarter.
Show solution
- Second quarter.
- \[\frac{2{,}250{,}000}{750{,}000} = 3.0\]
- Third quarter.
- \[\frac{1{,}800{,}000}{750{,}000} = 2.4\]
Answer: The team started the second quarter at its 3 times target and the third quarter at only 2.4 times. The shortfall was visible on June 1, before a single deal had been lost.
Why was coverage low on June 1? The pipeline for the third quarter should have been built in March, April and May. In those months the vacant territory that Maya later took over had no seller at all, and the inside team was covering it with inbound leads only. Prospecting across the rest of the team had also slowed while sellers worked a busy spring of renewals. The CRM showed that new pipeline created in April and May was about a fifth lower than in January and February.
Capacity was the last cause. Sam Whitehorse was on medical leave for six weeks in July, and his accounts were covered only for urgent customer requests. His attainment of 44 in 100 reflected his absence, and his quota had not been reduced. Grace counted this as a planning failure, not a performance problem.
Step 4: check the story against the data
Grace's draft diagnosis was plausible, which is exactly why she wanted Maya to test it. Maya checked four claims.
| Claim | Test | Result |
|---|---|---|
| The school slowdown is seasonal | Compare summer school win rates in previous years | Supported: summer 2025 school win rate was similar; fall rates were higher |
| RoomFlow deals slipped rather than being lost | Check whether summer RoomFlow opportunities were won in the fall | Partly supported: 6 of 11 slipped deals were won by November 13; 3 are open; 2 were lost |
| Andrew's results were just bad luck | Compare his late-stage conversion over three quarters | Not supported: the same pattern appeared in every quarter (lesson 3) |
| The forecast miss was caused by surprises | Check the slipped close dates and commit history | Not supported: most of the miss came from deals that had already slipped, as lesson 7 found |
Two of Grace's original claims survived and two did not. The tests changed the plan: if Andrew's pattern had been bad luck, no coaching would be needed, and if the forecast miss had been caused by genuine surprises, the forecasting method would not need to change. This is the value of checking: a diagnosis that has not been tested against data is an opinion.
Step 5: from causes to a plan
Grace and Maya grouped the confirmed causes and wrote one action for each, with a measure to track it. The actions were for the first quarter of fiscal 2027, December 2026 to February 2027, and are plans, not results.
| Cause | Action for the next quarter | Measure to watch |
|---|---|---|
| Low starting coverage | Every seller builds first-year pipeline to 3 times next quarter's quota by the quarter's start; Maya follows her prospecting plan from SLS-210 | Coverage on the first day of each quarter; new pipeline created each month |
| Rising no-decision losses | Mutual action plans and business cases for every deal above 15,000 dollars (SLS-211, SLS-212) | Share of losses that are no decision |
| Long RoomFlow cycles | Send the security package to customer IT at the Discover stage, not after the proposal | Median RoomFlow cycle length |
| School seasonality | Split 2027 quotas by quarter using history (lesson 6) and focus school prospecting on September to June | School win rate by quarter |
| Late-stage losses for one seller | Darnell coaches Andrew on discovery exit criteria; joint calls on Propose-stage deals | Andrew's Propose to Negotiate conversion |
| Capacity gaps | Reduce quotas for planned leave and cover vacant territories with a named seller | Attainment against adjusted quota |
| Forecast misses | Forecast categories with written reasons, checked against the weighted pipeline; large deals shown separately (lessons 7 and 8) | Forecast error and bias each quarter |
Rob asked which action mattered most. Grace's answer drew on velocity from lesson 4: no single lever would fix the quarter, but coverage came first, because every other improvement works on the pipeline the team has. A higher win rate applied to a thin pipeline still produces a thin quarter.
Worked problem
What the plan aims for
Suppose the plan restores the second-quarter win rate of 27 in 100 and the team closes 126 opportunities in the first quarter of 2027 at an average first-year deal of 21,000 dollars. What bookings would that produce, and how do they compare with a quarterly quota of 750,000 dollars?
Show solution
- Expected wins.
- \[126 \times 0.27 \approx 34 \text{ wins}\]
- Bookings.
- \[34 \times 21{,}000 = 714{,}000 \text{ dollars}\]
- \[\frac{714{,}000}{750{,}000} = 0.952\]
Answer: About 714,000 dollars, or about 95.2 in 100 of a 750,000-dollar quota, from the established sellers alone. Maya's first full quarter of 150,000 dollars would come on top, and closing more opportunities through better coverage would close the rest of the gap.
The arithmetic made a point Rob repeated to the owners: restoring the win rate alone would not quite be enough; the team also needed more pipeline, which is why coverage was first on the list.
Writing the diagnosis
Grace's written report to Rob was two pages. It followed a structure she recommended for any analysis that would be read by busy people.
| Section | Content |
|---|---|
| The answer first | The third quarter missed by 159,000 dollars because the team started with too little pipeline and then won fewer and smaller deals; the causes were seasonal, structural and fixable |
| The evidence | The driver tree, the coverage comparison, win rates by segment and the tested claims, each with its numbers |
| What we ruled out | Price: only 11 losses were on price, and the competitive win rate was about 52 in 100 |
| The plan | The seven actions, with owners, dates and measures |
| What we will check | The measures to review at the end of the first quarter, and what result would show the plan is not working |
Stating what was ruled out is easy to forget and very valuable. Several people at Ridgeline believed the company had lost the summer on price, and wanted a general price cut. The data did not support that: price losses were a small share, and the competitive win rate was strong. Saying so plainly prevented a costly change that would not have helped.
Bringing the course together
Maya looked back over the fall. In September she had a call count and one win. By November she could size her territory and its potential, convert a quota into the meetings it required, read her pipeline's coverage and velocity, build a weighted forecast and a categorized one and explain the difference, measure how good a forecast had been, design a dashboard that would tell her each Monday where to spend her week, and help diagnose a missed quarter. Darnell summed it up in the words he had used before the first session: good salespeople who can read their own numbers work hard on the right things.
The numbers in this course are fictional, but the methods are the ones sales teams use every day. The particular metrics and thresholds vary from company to company; the habits do not. Define every measure, compare it with something, check it another way, look at leading as well as lagging indicators, and test every story against the data before acting on it.
Following up the diagnosis
A diagnosis is only useful if someone checks, later, whether the plan worked. Grace put a date in the calendar for the first week of March 2027, after the first quarter of fiscal 2027 closed, to review each measure in the plan against its starting value. She also wrote down in advance what would count as success: coverage of at least 3 times on December 1, no-decision losses below 30 in 100 of all losses, a median RoomFlow cycle under 70 days, and a forecast error under 8 in 100. Writing the targets down before the results arrived prevented the team from redefining success afterwards.
Common mistakes
MistakeStarting the diagnosis with a favourite theory.
InsteadStart with the size of the gap and break it into parts.
MistakeExplaining a miss only by what happened during the quarter.
InsteadCheck upstream causes such as starting coverage and capacity.
MistakeAccepting a plausible story without testing it.
InsteadTest each claim against data; drop the ones that fail.
MistakeWriting a plan without measures.
InsteadGive each action a measure and a date to check it.
MistakeLeaving out what was ruled out.
InsteadState the causes the data did not support, to prevent costly wrong fixes.
Summary and key terms
- Diagnosing a missed quarter has five steps: size the gap, break it into parts, trace each part to causes, test the causes against data, and turn confirmed causes into a plan with measures.
- Ridgeline's third quarter was 159,000 dollars below quota and 153,000 below the second quarter.
- About 87,500 dollars came from fewer wins and about 65,500 from smaller deals.
- Win rate fell from 27 to 24 in 100 as no-decision losses rose and school deals stalled for the summer; large RoomFlow deals slipped because of longer IT reviews.
- Coverage at the start of the quarter was only 2.4 times, and one seller was on unplanned leave.
- Testing showed one seller's losses were a pattern and the forecast miss came from slipped deals.
- The plan put coverage first.
- Driver tree
- A diagram that breaks an outcome into the factors that produce it.
- Root cause
- The underlying reason for a result, as opposed to its immediate symptoms.
- Upstream cause
- A cause that acted before the period being diagnosed, such as weak prospecting the quarter before.
- Ruled out
- A possible cause that the data does not support.
- Action plan
- A list of actions with owners, dates and measures.
Practice problems
Work each problem on paper first, then reveal the answer to check.
Bookings fell from 20 wins at 25,000 dollars to 18 wins at 24,000 dollars. Split the change.
Show answer
Fewer wins: (18 − 20) × 25,000 = −50,000. Smaller deals: 18 × (24,000 − 25,000) = −18,000. Total: −68,000 dollars.
A team starts a quarter with 1,500,000 dollars of first-year pipeline and a quota of 600,000. What is its coverage?
Show answer
1,500,000 ÷ 600,000 = 2.5 times.
Why include what was ruled out in a diagnosis?
Show answer
It prevents expensive changes aimed at causes the data does not support.
Lesson quiz · 5 questions
Score 60% or more to complete this lesson.
Create a free account to save your progress, take quizzes and earn a certificate.