
SLS-214 · Lesson 3 of 12 · 24 min
Conversion rates by stage
▶ Video coming soon A video version of this lesson is on the way.
On October 2, Grace put a single chart on the boardroom screen: a funnel showing every opportunity Ridgeline's field team had created in the second quarter, March to May 2026, and how far each one got. One hundred and twenty opportunities had entered the first stage. Twenty-seven had been won. "Everyone in sales knows the funnel narrows," Grace said. "The useful question is where it narrows, and whether it narrows more than it should."
Lesson 2 showed how activity ratios link the steps before an opportunity exists. This lesson follows opportunities through the pipeline stages and measures how many move from each stage to the next. These stage conversion rates are the main tool for finding where a sales process leaks.
Stages and conversion
Ridgeline's opportunity stages, described in SLS-140, are Qualify, Discover, Propose and Negotiate, followed by Closed Won or Closed Lost. Each stage has exit criteria: an opportunity moves to Discover only when the seller has confirmed a real need and a buyer willing to explore it, to Propose only when discovery is complete, and so on. Because the stages have clear criteria, the share of opportunities that pass each one says something real about the sales process.
Conversion rates are only meaningful when every opportunity is counted once in each stage it reached, including those that later moved on. An opportunity that is now in Negotiate also passed through Qualify, Discover and Propose, so it counts in all four.
Cohort and snapshot views
There are two ways to count, and they give different answers. A snapshot counts how many opportunities are in each stage today. A cohort follows a group of opportunities created in the same period and counts how far each one eventually got. Snapshots are good for managing today's pipeline; cohorts are the right way to measure conversion.
The reason is timing. In a snapshot taken on October 2, many of the opportunities in Qualify were created last week and have not had time to move. Comparing them with the number in Negotiate would make conversion look terrible. A cohort created in March to May had about four months to run its course by October, long enough for nearly all of its deals to close, so its counts reflect what really happened.
| Snapshot | Cohort | |
|---|---|---|
| What it counts | Opportunities in each stage on one date | How far each opportunity in a group got |
| Good for | Managing today's pipeline, spotting pile-ups | Measuring conversion and comparing periods |
| Main risk | Mixing young and old deals makes conversion look worse | Recent cohorts are incomplete; deals are still open |
| Ridgeline use | Weekly pipeline review | Quarterly conversion review, on a cohort at least four months old |
The second-quarter cohort
Worked problem
Stage conversion for the team
Of the 120 opportunities Ridgeline's field team created in March to May 2026, 84 reached Discover, 57 reached Propose, 38 reached Negotiate and 27 were won. Calculate each stage conversion rate and the overall rate from Qualify to won.
Show solution
- Qualify to Discover.
- \[\frac{84}{120} = 0.700\]
- Discover to Propose.
- \[\frac{57}{84} = 0.679\]
- Propose to Negotiate.
- \[\frac{38}{57} = 0.667\]
- Negotiate to won.
- \[\frac{27}{38} = 0.711\]
- Overall, from Qualify to won.
- \[\frac{27}{120} = 0.225\]
- The overall rate is the product of the stage rates.
- \[0.700 \times 0.679 \times 0.667 \times 0.711 \approx 0.225\]
Answer: The stage rates are about 70, 68, 67 and 71 in 100, and about 22.5 in 100 of opportunities created were won. Because the overall rate is the product of the stage rates, improving any one stage improves the whole.
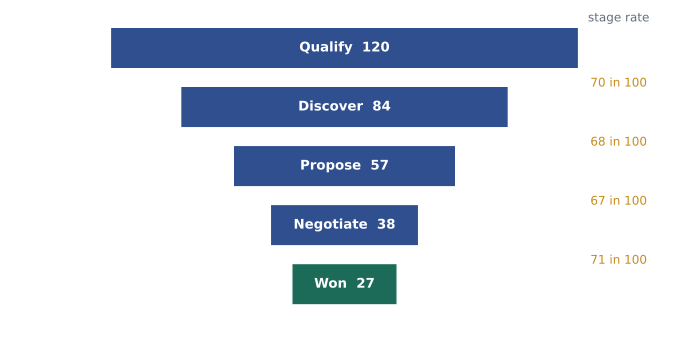
The team's rates were fairly even, which told Grace that no single stage was broken. That made the next comparison, between sellers, more interesting.
Finding the leak: comparing sellers
Team averages hide differences between people. Grace showed the same cohort for two of the five established account executives, Andrew Ferguson and Kevin Moreau.
| Stage reached | Andrew | Kevin |
|---|---|---|
| Qualify | 24 | 26 |
| Discover | 21 | 18 |
| Propose | 17 | 14 |
| Negotiate | 9 | 12 |
| Won | 5 | 9 |
Worked problem
Where does Andrew's funnel leak?
Using the table, calculate each stage rate for Andrew and Kevin, and their overall rates.
Show solution
- Andrew: 21 ÷ 24 = 0.875; 17 ÷ 21 = 0.810; 9 ÷ 17 = 0.529; 5 ÷ 9 = 0.556.
- Andrew overall.
- \[\frac{5}{24} = 0.208\]
- Kevin: 18 ÷ 26 = 0.692; 14 ÷ 18 = 0.778; 12 ÷ 14 = 0.857; 9 ÷ 12 = 0.750.
- Kevin overall.
- \[\frac{9}{26} = 0.346\]
Answer: Andrew moves almost everything through the first two stages (about 88 and 81 in 100) but loses about half his deals at Propose and again at Negotiate. Kevin qualifies harder early (about 69 in 100) and then converts about 86 and 75 in 100 of what he proposes and negotiates. Kevin wins about 35 in 100 overall; Andrew about 21.
The pattern is common. A seller who advances nearly every opportunity through the early stages has usually not done enough discovery, so the problems surface later, when the proposal does not match what the customer needed or the price comes as a surprise. Andrew's high early conversion was not a strength; it was the cause of his late losses. Darnell's coaching for him focused on the exit criteria for Discover, which SLS-211 covered: a confirmed problem, its impact, the decision process and the people involved.
Grace added a caution. Twenty-four and twenty-six opportunities are small numbers. The difference between 5 and 9 wins could partly be luck. But the pattern, high early conversion followed by heavy late losses, had shown up for Andrew in three quarters running, which made it much more than noise.
Reading conversion patterns
Different leaks point to different causes. Grace kept a short table of the patterns she saw most often.
| Pattern | Likely cause | Where to look |
|---|---|---|
| Low Qualify to Discover | Poor targeting or weak first meetings | Ideal customer profile, prospect research, opening questions |
| High early conversion, low late conversion | Thin discovery; problems found too late | Discovery exit criteria, stakeholder mapping |
| Low Propose to Negotiate | Proposals that miss the need or the budget | Proposal quality, value case, pricing |
| Low Negotiate to won | Losing to competitors or to no decision late | Loss reasons, negotiation, decision process |
| Deals stuck in one stage | Missing next steps or unclear criteria | Time in stage, CRM next-step fields |
Loss reasons help here. Every opportunity Ridgeline closes as lost must have a reason chosen from a short list: lost to a competitor, no decision, price, timing, no budget, or qualified out by Ridgeline. When late-stage losses cluster under "no decision", the problem is usually that the buyer never had a strong enough reason to change, which points back to discovery again.
Time in stage
Conversion measures whether deals move; time in stage measures how fast. Ridgeline's CRM records the date an opportunity enters each stage, so Grace could calculate how long each deal spent in each one. For the second-quarter cohort, the median times were about 9 days in Qualify, 18 in Discover, 16 in Propose and 12 in Negotiate.
Time in stage connects to the stage limits in Ridgeline's CRM (21, 30, 30 and 21 days, from SLS-140). An opportunity that stays in a stage longer than its limit is flagged for review. It may be fine, because some buyers move slowly, but deals that sit still tend to die. In the second-quarter cohort, opportunities that exceeded the Propose limit were won only about half as often as those that did not.
Using conversion rates to plan
Conversion rates turn a target into a plan for the pipeline, just as activity ratios do for the steps before it.
Worked problem
How many opportunities does the team need?
Ridgeline wants its five established account executives to win 40 deals between them in a quarter. At the second-quarter overall conversion rate of 22.5 in 100, how many new opportunities do they need to create?
Show solution
- Divide the wins needed by the overall conversion rate.
- \[\frac{40}{0.225} = 177.8\]
- Round up, because opportunities are whole.
Answer: About 178 new opportunities, roughly 36 per account executive, assuming conversion stays at the second-quarter level and the deals have time to close within the planning window.
The planning calculation shows why small improvements in conversion matter. If the team raised Propose to Negotiate from 67 to 75 in 100, the overall rate would rise from about 22.5 to about 25.4 in 100, and the same 40 wins would need only about 158 opportunities, 20 fewer. Improving conversion is often cheaper than finding more prospects.
Conversion in retail
The idea carries over to retail with different stages. Juniper & Pine measures the share of shopping groups who are greeted, the share of greeted groups who have a real conversation with an associate, and the share of those who buy. SLS-250 used these figures to compare associates. The principle is the same as at Ridgeline: the overall rate is the product of the stage rates, and the stage where an associate differs most from the store average is where coaching should start.
Conversion over time
Conversion rates are worth tracking quarter by quarter, because a change is often the first sign that something in the market or the process has shifted. Grace kept a small table with one row per quarterly cohort and one column per stage rate. When a rate moved by more than about five points in either direction, she looked for a reason before the next quarterly review.
Two kinds of reason are common. Some are internal: a new proposal template, a change in who qualifies inbound leads, or a new product that sellers are still learning to position. Others are external: a competitor's price cut, a slowdown in one industry, or a change in how customers buy. When Ridgeline began selling RoomFlow in 2025, the Propose to Negotiate rate for software deals was well below the rate for printers, because sellers were still learning which customers' IT teams would approve cloud software. By the second quarter of 2026 the gap had narrowed as sellers learned to involve IT earlier.
Recent cohorts need special care. A cohort created last month has barely started, so its later-stage rates are still rising. Grace's rule was to report a cohort's rates only once it was at least two median cycle lengths old, about four months at Ridgeline, and to label any earlier figures as incomplete. Without that label, managers tended to conclude that conversion was collapsing when in fact deals simply had not had time to move.
Worked problem
Is the newest cohort really worse?
In mid-September, the third-quarter cohort of 112 opportunities showed only 14 wins so far, against 27 for the second-quarter cohort of 120. A manager says conversion has halved. What should Grace check before agreeing?
Show solution
- Compare like with like: the second-quarter cohort had about four months to close; the third-quarter cohort had less than two.
- Calculate the third-quarter figure so far.
- \[\frac{14}{112} = 0.125\]
- Compare with how the second-quarter cohort looked at the same age, about six weeks after its last opportunity was created. If it showed a similar share of wins then, the difference is timing, not performance.
Answer: Grace should compare the two cohorts at the same age. A raw comparison of 12.5 in 100 against 22.5 in 100 mixes a young cohort with a mature one and exaggerates any decline.
Stage conversion also supports coaching conversations that feel fair. Instead of telling a seller that her results are poor, a manager can show her where her funnel differs from the team's and ask what is happening at that stage. Darnell found that sellers almost always knew the answer once they saw their own numbers beside the team's, and that the fix they proposed was usually better than the one he would have suggested.
Common mistakes
MistakeCalculating conversion from a snapshot of today's pipeline.
InsteadUse a cohort old enough for most of its deals to have closed.
MistakeCounting an opportunity only in the stage it is in now.
InsteadCount it in every stage it reached.
MistakeTreating high early conversion as a strength in itself.
InsteadCheck later stages; pushing weak deals forward early often causes late losses.
MistakeDrawing firm conclusions from a seller's single quarter.
InsteadLook for patterns over several quarters, and give the counts behind each rate.
MistakeIgnoring how long deals sit in each stage.
InsteadTrack time in stage; stalled deals are a warning sign even when conversion looks normal.
Summary and key terms
- A stage conversion rate is the share of opportunities entering a stage that reach the next one.
- Cohorts, which follow opportunities created in the same period, measure conversion properly; snapshots are for managing today's pipeline.
- In Ridgeline's second-quarter cohort, 120 opportunities became 27 wins, about 22.5 in 100, and the overall rate is the product of the stage rates.
- Comparing sellers shows where funnels leak: Andrew advanced nearly everything early and lost heavily late, a sign of thin discovery.
- Loss reasons and time in stage help explain patterns.
- Conversion rates turn a win target into the number of opportunities needed, and small improvements in one stage can save many opportunities.
- Stage conversion rate
- The share of opportunities entering a stage that reach the next stage.
- Cohort
- A group of opportunities created in the same period, followed to see how far each one got.
- Snapshot
- A count of opportunities in each stage on one date.
- Time in stage
- How long an opportunity spends in a stage before moving on or closing.
- Loss reason
- The recorded cause of a lost opportunity, chosen from a fixed list.
- Exit criteria
- The conditions an opportunity must meet before it moves to the next stage.
Practice problems
Work each problem on paper first, then reveal the answer to check.
A cohort of 80 opportunities produced 60 in Discover, 42 in Propose, 30 in Negotiate and 21 wins. What is the Propose to Negotiate rate?
Show answer
30 ÷ 42 = 0.714, about 71 in 100.
At an overall conversion rate of 20 in 100, how many opportunities are needed for 15 wins?
Show answer
15 ÷ 0.20 = 75 opportunities.
Why is a snapshot a poor way to measure conversion?
Show answer
It mixes new deals that have not had time to move with older ones, so conversion looks lower than it is.
Lesson quiz · 5 questions
Score 60% or more to complete this lesson.
Create a free account to save your progress, take quizzes and earn a certificate.