
SLS-230 · Lesson 12 of 12 · 22 min
Case study: turning around a team
▶ Video coming soon A video version of this lesson is on the way.
This final lesson brings the course together in one case: Ridgeline's field sales team, which had a bad third quarter in fiscal 2026 and had not fully recovered by November. On Friday, November 13, 2026, Rob Kowalski asked Darnell Brooks to present a 90-day plan for the first quarter of fiscal 2027, December 2026 to February 2027, to the owners the following week. Darnell spent the afternoon with Grace Liu working through the data, and the plan they drafted uses almost every tool from the earlier lessons. A shorter case at the end looks at a turnaround on the Juniper & Pine sales floor.
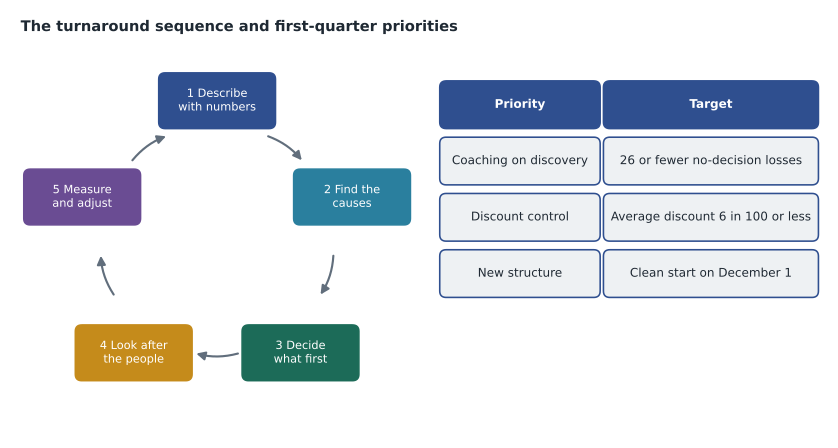
A turnaround is not a single fix. It is a sequence: understand what has changed and why, decide what to do first, act on the people, process and plan sides together, measure whether it is working, and keep the team with you while you do it. Leaders who skip the first step and go straight to action often fix the wrong thing.
Step 1: Describe the problem with numbers
Darnell started with the results. In the second quarter of fiscal 2026, March to May, the field team booked 744,000 dollars of first-year revenue from 34 wins. In the third quarter, June to August, it booked 591,000 dollars from 30 wins, about 79 in 100 of the 750,000 dollar quarterly quota. The fourth quarter looked likely to finish between 760,000 and 800,000, which was better, but that recovery depended heavily on the Prairie Valley contract, a single large deal that was not repeatable.
| Measure | Q2 fiscal 2026 | Q3 fiscal 2026 | Change |
|---|---|---|---|
| First-year revenue booked | 744,000 | 591,000 | −153,000 |
| Opportunities closed (won or lost) | 126 | 125 | −1 |
| Win rate | 27 in 100 (34 of 126) | 24 in 100 (30 of 125) | −3 points |
| Average first-year revenue per win | 21,882 | 19,700 | −2,182 |
| Open opportunities at quarter start | 90 | 84 | −6 |
| Median sales cycle (days) | 61 | 70 | +9 |
| Losses to "no decision" | 26 | 38 | +12 |
Worked problem
Breaking down the decline
Revenue booked equals opportunities closed × win rate × average revenue per win. Starting from the second quarter and changing one factor at a time to its third-quarter value, how much of the 153,000 dollar fall comes from each factor?
Show solution
- \[\text{Q2} = 126 \times \frac{34}{126} \times 21{,}882 \approx 744{,}000\]
- \[\text{Change closed to 125: } 125 \times 0.2698 \times 21{,}882 \approx 738{,}100 \quad (-5{,}900)\]
- \[\text{Change win rate to 0.24: } 125 \times 0.24 \times 21{,}882 \approx 656{,}500 \quad (-81{,}600)\]
- \[\text{Change revenue per win to 19{,}700: } 125 \times 0.24 \times 19{,}700 = 591{,}000 \quad (-65{,}500)\]
- Check: 5,900 + 81,600 + 65,500 = 153,000.
Answer: Almost none of the fall came from the number of deals the team worked. About 81,600 dollars came from a lower win rate and about 65,500 from smaller wins. The order in which factors are changed affects the split slightly, but the conclusion is clear: the problem was winning and deal size, not activity.
The rise in "no decision" losses, from 26 to 38, pointed to the same thing. Customers were not choosing competitors more often; they were deciding not to change at all. That usually means the seller has not shown the customer clearly enough why change matters, which is a discovery and value problem. It matched what Darnell had seen in Andrew Ferguson's calls in lesson 5.
Worked problem
Measuring the fall in sales velocity
Sales velocity estimates how much revenue the pipeline produces per day: open opportunities × win rate × average revenue per win ÷ cycle length in days. Using the start-of-quarter opportunities, what was the team's velocity in each quarter?
Show solution
- \[\text{Q2} = \frac{90 \times 0.27 \times 21{,}882}{61} \approx 8{,}717 \text{ dollars a day}\]
- \[\text{Q3} = \frac{84 \times 0.24 \times 19{,}700}{70} \approx 5{,}674 \text{ dollars a day}\]
- \[\frac{5{,}674}{8{,}717} \approx 0.65\]
Answer: Velocity fell to about 65 in 100 of its second-quarter level, because every factor moved the wrong way at once: fewer opportunities, a lower win rate, smaller deals and longer cycles. Small changes in several factors multiply into a large change in results.
Step 2: Find the causes
Numbers show where a problem is, but rarely why. Darnell and Grace listed possible causes and checked each against evidence. Some were outside the team's control; others were not.
| Possible cause | Evidence | Conclusion |
|---|---|---|
| Summer season | Q3 is always the slowest quarter, but last year's Q3 was 8 in 100 below Q2, not 21 | Explains part, not all |
| Sam Whitehorse's six-week leave | Sam booked 66,000 against 150,000; his quota was not reduced | Explains part; quota rules needed changing |
| Weak discovery leading to no-decision losses | No-decision losses up from 26 to 38; call reviews show early pitching | Main cause |
| Discounting to close, shrinking deals | Average discount on Q3 wins 9 in 100, up from 6 | Contributes to smaller deals |
| Unbalanced territories | Potential ranged from 2.4 to 3.9 million dollars | Affects fairness more than total |
| Too few new opportunities | Opportunities fell only from 90 to 84 | Minor |
They were careful not to overreact to Sam's result. His six-week medical leave in July was a reason for a lower quarter, not a performance problem, and under the new quota rules in lesson 7 his quota would have been reduced. Treating it as a performance issue would have been unfair and, given that it followed a medical leave, could have raised legal concerns about how the company treated an employee returning from leave.
Step 3: Decide what to do first
A team cannot change everything at once. Darnell chose three priorities for the first quarter of fiscal 2027, each tied to a cause and a measure.
- Win more of the deals already in the pipeline: weekly skill coaching on discovery for every account executive, using the GROW approach and call reviews from lesson 5, with a target of cutting no-decision losses to 26 or fewer in the quarter.
- Protect deal size: no discount above 5 in 100 without Darnell's approval and a written reason, with the accelerator in the new pay plan rewarding total margin rather than volume alone, and a target of average discounts back to 6 in 100 or less.
- Start the new structure cleanly: new territories, quotas and pods in place on December 1, joint introductions for every moved account in the first three weeks, and the January hire onboarded with the new 30-60-90 day plan.
He deliberately left some ideas out. A new prospecting campaign would add activity, but activity had not been the problem. A contest would add excitement, but would not fix discovery, and might encourage discounting. Choosing what not to do, he said, was as important as choosing what to do.
Step 4: Look after the people
Turnarounds put pressure on people, and the people most affected are often not the ones who caused the problem. Darnell planned individual conversations with each seller in the first week of December: to explain the plan and the reasons, to agree each seller's two coaching priorities, and to ask what was getting in their way. He would recognize progress on the measures each Friday, as in lesson 10, not only closed deals. And he would watch workload: the territory changes and the January hire would add work for Kevin Moreau and Lisa Tran in particular.
If, after a fair period of coaching, a seller still could not meet reasonable expectations, the next step would be a written performance plan, with clear goals, support and a timeline, followed by a decision. Darnell did not expect to need one in the first quarter. He wanted every seller to know where they stood, so that nobody would be surprised, as Rob's rule from lesson 1 required.
Worked problem
Setting the first-quarter targets
For the first quarter of fiscal 2027, Darnell expects about 120 opportunities to close across the seven sellers (including about 10 for the new hire's first weeks). If the plan lifts the win rate back to 27 in 100 and average revenue per win to 21,000 dollars, what first-year revenue would the team book? How does that compare with the sum of the first-quarter quotas, which is about 897,000 dollars after seasonal splitting and the new hire's ramp?
Show solution
- \[120 \times 0.27 \times 21{,}000 = 680{,}400 \text{ dollars}\]
- \[\frac{680{,}400}{897{,}000} \approx 0.759 = 75.9 \text{ in } 100\]
Answer: Even if the plan works, the team would reach only about 76 in 100 of its first-quarter quotas, because quotas were set for a growth year. Darnell's plan therefore had to say honestly that the first quarter was about rebuilding win rates and deal size, with the full benefit expected from the second quarter, and that 120 closed opportunities might need to rise to about 155 to reach quota at those rates. Presenting that honestly to the owners was part of the plan.
Step 5: Measure and adjust
Darnell set a short list of leading measures to watch weekly and lagging measures to review monthly. Leading measures change early and predict results: discovery quality scores from call reviews, the share of first meetings that become proposals, average discount on proposals. Lagging measures show results after the fact: win rate, revenue booked, average deal size. He agreed with Rob to review the plan formally on January 15 and February 15, 2027, and to change course if the leading measures had not moved by the first review.
A shorter case on the sales floor
Juniper & Pine's upholstery department, which had sold 3.6 million dollars in 2025, was flat for 2026 while appliances and mattresses grew. Bev Halvorsen's analysis followed the same steps. The numbers showed that traffic to the upholstery gallery was steady, but conversion had fallen: fewer visitors to the gallery were buying. The causes she found were that two of the department's experienced sellers had moved to appliances, and that a larger share of upholstery buyers now wanted custom fabrics and sizes, which newer sellers explained less confidently.
Her plan for the 2027 season had three parts, all from earlier lessons: certify every floor seller in custom upholstery orders, as she was doing for appliances; pair newer sellers with Carl Jensen for custom orders in the first months, a role that also tested Carl's interest in the assistant manager position; and track upholstery conversion and average ticket weekly, with recognition for improvement. Like Darnell, she chose not to run an upholstery contest, because the problem was knowledge, not effort.
On Friday, November 27, Carl would tell Bev his decision about the assistant manager role. Whatever he decided, the floor's turnaround plan would go ahead. Bev's view, shared with the new seasonal sellers on their first day, summed up the course: a sales team gets better when its leaders understand where results come from, set fair goals, coach the skills that matter, reward what they want more of and treat people honestly.
Communicating the plan
Darnell's last task was to decide how to explain the plan. He drafted three versions. For Rob and the owners: one page with the numbers, the causes, the three priorities, the realistic first-quarter target and the review dates. For the team: a 20-minute meeting on Tuesday, December 1, explaining what had happened in plain terms, what would change and why, followed by the individual conversations. For customers whose accounts were moving: a joint visit or call from both sellers, focused on what the customer would gain.
He was careful about tone with the team. He did not want the meeting to sound like blame for the third quarter, because most of the causes, including weak discovery and the habit of discounting, had grown under his own leadership and Ridgeline's old pay plan. He planned to say so directly, which also showed the team the honesty he expected from them. Grace pointed out that the team would watch what he did in the first two weeks more closely than what he said in the meeting: whether coaching sessions actually happened, whether discount approvals were applied to everyone and whether Sam's quota adjustment was handled as promised.
A turnaround plan, he concluded, is a promise to the team as much as to the owners. Keeping the small promises early is what makes the larger ones believable.
Common mistakes
MistakeActing before understanding what changed.
InsteadDescribe the problem with numbers and break the decline into its factors.
MistakeAssuming low results mean too little activity.
InsteadCheck whether the problem is activity, win rate, deal size or cycle length.
MistakeTreating a result caused by a leave or territory change as poor performance.
InsteadSeparate causes outside the seller's control and adjust fairly.
MistakeLaunching many initiatives at once.
InsteadChoose a few priorities tied to causes and measures, and say what you will not do.
MistakeHiding the expected shortfall from senior leaders.
InsteadPresent realistic targets and when results will improve.
Summary and key terms
- A turnaround is a sequence: describe the problem with numbers, find the causes, decide what to do first, look after the people and measure and adjust.
- Breaking revenue into opportunities closed, win rate and revenue per win shows which factor drove a decline; sales velocity shows how small changes in several factors multiply.
- Causes should be checked against evidence, separating those outside the team's control, such as a medical leave, from those the team can fix.
- A few priorities tied to causes and measures work better than many initiatives.
- People need explanation, individual conversations, recognition of progress and fair performance processes.
- Leading measures change early and predict results; lagging measures confirm them.
- Leaders should present realistic targets honestly.
- The same sequence applies on a retail floor.
- Turnaround
- A planned effort to restore a team's results after a decline.
- Sales velocity
- Open opportunities × win rate × average deal value ÷ cycle length.
- No-decision loss
- An opportunity lost because the customer chose not to change at all.
- Leading measure
- A measure that changes early and predicts later results.
- Lagging measure
- A measure that shows results after the fact.
- Performance plan
- A written plan setting goals, support and a timeline for a seller who is not meeting expectations.
Practice problems
Work each problem on paper first, then reveal the answer to check.
Revenue is 100 closed × 25 in 100 win rate × 20,000 dollars. If the win rate falls to 20 in 100, how much revenue is lost?
Show answer
Before: 100 × 0.25 × 20,000 = 500,000. After: 100 × 0.20 × 20,000 = 400,000. Loss: 100,000 dollars.
A pipeline has 80 opportunities, a 25 in 100 win rate, 20,000 dollars average and a 50-day cycle. What is the velocity?
Show answer
80 × 0.25 × 20,000 ÷ 50 = 8,000 dollars a day.
Why did Darnell decide against a sales contest in the turnaround?
Show answer
The problem was discovery and discounting, not effort, and a contest might encourage more discounting.
Lesson quiz · 5 questions
Score 60% or more to complete this lesson.
Create a free account to save your progress, take quizzes and earn a certificate.