
SLS-251 · Lesson 11 of 12 · 23 min
Measuring merchandising results
▶ Video coming soon A video version of this lesson is on the way.
By the second week of November, Noura had made a series of changes to the store: the clearance corner moved to the main loop on October 5, the feature table restyled, the cushion wall replanned, the mattress gallery relit and the side aisles cleared. On the Tuesday merch walk of November 10 she put the paintbrush away and opened a spreadsheet. "Everything we have done this fall was a guess," she told Aiden. "Some good guesses, I hope. Today we find out which ones actually changed what shoppers did, and which ones only made me feel better."
Merchandising changes cost time and money, and the people who approve them reasonably want to know whether they work. Measuring results is also how a merchandiser learns. Without it, every opinion about displays is as good as every other. This lesson covers the measures merchandisers use, the main ways that before-and-after comparisons mislead, and how to set up simple, fair tests on a store floor.
What to measure
No single number captures whether merchandising works. Merchandisers choose the measures that match what a change was meant to do.
| Measure | What it shows | How it is calculated |
|---|---|---|
| Traffic | How many shoppers came in | Door counts, by hour and day |
| Capture rate | How far shoppers got into the store | Groups entering an area divided by groups entering the store (lesson 1) |
| Stop rate or dwell | Whether a display or window held attention | Share of passers-by who stopped; time spent |
| Conversion | Whether shoppers in an area bought | Transactions divided by shopping groups in the area |
| Sales per unit of area | How hard a display or department works its space | Sales divided by floor area, for a set period |
| Sell-through | How much of the available stock sold | Units sold divided by units available during the period |
| Attachment rate | Whether cross-merchandised items sold with the main item | Sales with the add-on divided by sales of the main item |
| Out-of-stocks and compliance | Whether fixtures matched their plans and stayed full | Gaps and planogram errors found on audits |
Sales per unit of area deserves a closer look, because it lets merchandisers compare very different displays and departments. A feature table, a cushion wall and a sofa vignette sell different products at different prices, but each can be judged by how much it sells for each unit of floor it uses. SLS-253 develops sales and margin per area for whole departments; here it is used for single displays.
Worked problem
How hard is the feature table working?
The restyled feature table at the entrance uses about 3 square metres of floor. In the four weeks from October 6 to November 2 it sold 2,880 dollars of throws, cushions and candles. Over the same four weeks the décor department as a whole sold about 550 dollars per square metre. How does the table compare?
Show solution
- Sales per square metre at the table:
- \[2{,}880 \div 3 = 960\ \text{dollars per m}^2\]
- Compare with the department average:
- \[960 \div 550 \approx 1.75\]
Answer: The table sold about 960 dollars per square metre in four weeks, about 1.75 times the department average. A feature table at the entrance should outperform the average, because it gets far more traffic, so the right comparison for judging the restyle is the table before and after, adjusted for the trend, as in lesson 5.
Why before and after can mislead
The most natural test is to compare results before a change with results after it. It is also the easiest to get wrong, because many other things change at the same time.
| Problem | Example at Juniper & Pine | How to deal with it |
|---|---|---|
| Seasonality | Throws sell more in November than in September, display or no display | Compare with the same weeks last year, or with a control |
| Promotions and prices | A sale on recliners the same week a new display goes up | Avoid changing price and display at the same time, or note it |
| Traffic changes | A busy long weekend after the change | Compare rates, such as conversion, not raw totals |
| Small numbers | A display that sold 6 items, then 9 | Measure over longer periods; treat small differences as hints |
| Several changes at once | New lighting and a new layout in the same week | Change one thing at a time where possible |
| Novelty | Staff and regular shoppers pay extra attention to anything new | Keep measuring for several weeks, not just the first few days |
Using a control
The fairest simple test compares the change at the place that was changed with the change at a similar place that was not, over the same period. The unchanged place is the control. Lesson 5 used the décor rack as a control for the feature table. Another common control is the same weeks last year, which captures seasonal patterns. The logic is the same either way:
If the test and the control both rose by the same amount, the adjusted change is 1, meaning the change made no difference. If the test rose much more than the control, the change probably helped.
Worked problem
Did the new lighting help the mattress gallery?
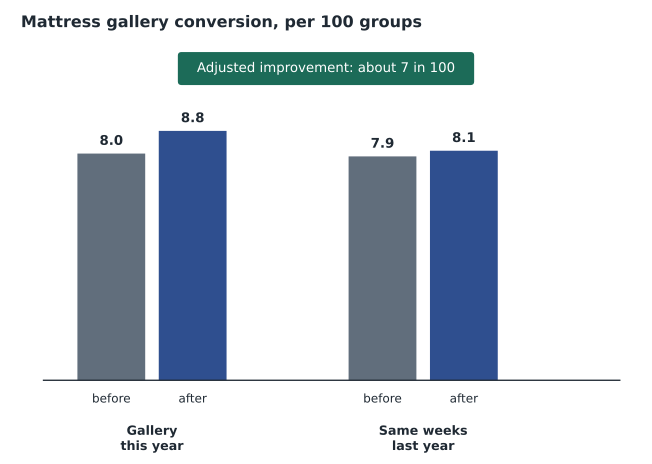
The LED lighting was installed in the mattress gallery in mid-September. Comparing the second half of September with the second half of October, the gallery had 2,150 groups enter and 172 mattress sales before, and 2,240 groups and 197 sales after. Last year, for the same weeks with no change, the gallery's conversion went from 7.9 to 8.1 in 100. What was the gallery's conversion before and after, and what was the change adjusted for last year's pattern?
Show solution
- Conversion before:
- \[172 \div 2{,}150 = 0.080\]
- Conversion after:
- \[197 \div 2{,}240 \approx 0.088\]
- Change at the gallery:
- \[0.088 \div 0.080 \approx 1.10\]
- Change last year in the same weeks:
- \[8.1 \div 7.9 \approx 1.025\]
- Adjusted change:
- \[1.10 \div 1.025 \approx 1.07\]
Answer: Conversion rose from 8.0 to about 8.8 in 100. Part of that rise happens every year as fall shopping picks up, so the adjusted improvement is about 7 in 100, not 10. With about 200 sales in each period, a difference that size could still be chance, so Noura recorded it as "promising, not proven" and planned to compare the full fourth quarter with last year.
Measuring the clearance move
The first change of the fall, moving the clearance corner from behind appliances to the main loop, was also the easiest to measure, because nothing else about clearance changed: same markdowns, same signs, same products from the same suppliers.
Worked problem
Did moving clearance help it sell?
In the four weeks before the move, clearance started with 120 items and sold 30. In the four weeks after the move, it started with 110 items, including newly marked-down fall stock, and sold 52. A repeat count on November 7 found that 31 in 100 of the store's shoppers entered the clearance area, compared with 14 in 100 in the October 3 count. What was the sell-through before and after?
Show solution
- Sell-through before:
- \[30 \div 120 = 0.25\]
- Sell-through after:
- \[52 \div 110 \approx 0.47\]
Answer: Sell-through rose from 25 to about 47 in 100, and the capture rate more than doubled, from 14 to 31 in 100. Because markdowns and signs did not change, the move is the most likely cause, although the arrival of fresh fall clearance may also have drawn shoppers. Noura judged it a clear success and kept the new location.
Designing a fair test
Most merchandising tests in a single store are informal, and that is fine as long as they follow a few rules.
| Rule | Why |
|---|---|
| Write down what you expect before the change | It stops you from deciding afterward that whatever happened was the goal |
| Pick the measure that matches the goal | A display meant to sell add-ons should be judged by attachment rate, not by traffic |
| Change one thing at a time where possible | Otherwise you cannot tell which change mattered |
| Use a control | Season, traffic and promotions affect everything; the control shows how much |
| Run it long enough | At least two to four weeks for most displays, so that weekly swings and novelty even out |
| Record everything that happened in the period | Promotions, weather, staff changes and stock problems can explain surprises |
Chains with many stores can run more formal tests, changing a display in some stores and not others, and using statistics to judge whether differences are larger than chance. A single store cannot, but it can still be careful. Treating each result as "strong", "promising" or "no clear effect", rather than as proof, is a sensible habit.
Keeping a merchandising log
Measuring needs records, and the simplest record is a log. Noura keeps a running list of every change to the floor: the date, what changed, why, the measure she will use, the control, and the date she will review it. It takes a minute per change. Without it, the November review would have been guesswork, because by then nobody could remember exactly when the gallery lights went in or which week the cushion wall was replanned. The log also catches overlapping changes: when Noura saw that a recliner promotion and a new recliner display were both planned for the same week in January, she moved the display back two weeks so each could be judged on its own.
The log feeds a short weekly view that Noura checks on Monday mornings with the sales report: sales and conversion by department against the same week last year, sell-through of featured and clearance items, and any out-of-stocks or compliance problems from the weekend. Most weeks nothing needs action. The point is to notice early when something has gone wrong, such as a best seller that has run out or a display that is selling far below its plan, rather than finding out at the end of the season.
Listening as well as counting
Numbers show what changed; people explain why. Noura asks associates what shoppers say about new displays, reads comments on Tessa's social media posts, and notes complaints and compliments at the sales desk, such as the two notes about the aisles in lesson 10. She also watches. Ten minutes of watching shoppers at a display often shows something the sales figures cannot: that people pick up a product and put it down when they see the price, that they cannot find the size they want, or that they photograph a vignette to show someone at home.
Returns and complaints are measures too. A display that sells well but leads to many returns, for example because the lighting made a fabric look a different colour, is not a success. Juniper & Pine tracks returns by the department where the product was bought, and Noura looks at them before calling any change a success.
Reporting results
Noura reports to Bev once a month on a single page: each change made, its goal, the measure, the result with its control, and a judgment. The November report listed five changes. Two were clear successes (the clearance move and the cushion planogram, which cut out-of-stocks of the rust velvet cushion from four weekends in a row to none). Two were promising but not yet proven (the gallery lighting and the restyled feature table). One, a new sign style in appliances, showed no clear effect and would be tested again in January. A short, honest report like this builds trust, and makes the next request for time or money easier.
Common mistakes
MistakeSales went up after the change, so it worked.
InsteadCompare with a control, such as a similar unchanged area or the same weeks last year.
MistakeUse the same measure for every change.
InsteadPick the measure that matches the change's goal: capture, conversion, sell-through or attachment.
MistakeJudge a new display after one weekend.
InsteadRun tests for at least two to four weeks so weekly swings and novelty even out.
MistakeA 10-item difference proves the point.
InsteadWith small numbers, treat differences as hints and keep measuring.
MistakeNumbers are all you need.
InsteadAlso watch shoppers, ask associates and check returns and complaints.
Summary and key terms
- Choose measures that match each change's goal: traffic, capture rate, stop rate, conversion, sales per area, sell-through, attachment or compliance.
- Sales per unit of area lets merchandisers compare very different displays.
- Before-and-after comparisons mislead because of season, promotions, traffic, small numbers, several changes at once and novelty.
- A control, a similar unchanged area or the same weeks last year, shows what would have happened anyway.
- Fair tests set expectations in advance, change one thing at a time, run long enough and record everything that happened.
- Combine numbers with observation, staff feedback and returns, and report results honestly as strong, promising or unclear.
- Conversion
- Transactions divided by shopping groups, for a store or an area.
- Sales per unit of area
- Sales divided by the floor area used, for a set period.
- Sell-through
- Units sold divided by units available during a period.
- Control
- A comparable area or period without the change, used to separate the change's effect from other causes.
- Novelty effect
- Extra attention that anything new receives at first, which fades over time.
Practice problems
Work each problem on paper first, then reveal the answer to check.
A display uses 4 square metres and sells 3,200 dollars in four weeks. What are its sales per square metre?
Show answer
3,200 divided by 4 is 800 dollars per square metre.
An area's conversion rises from 10 to 12 in 100, and a control's from 10 to 11. What is the adjusted change?
Show answer
1.2 divided by 1.1 is about 1.09, an adjusted improvement of about 9 in 100.
A product line starts a month with 80 units and sells 36. What is its sell-through?
Show answer
36 divided by 80 is 0.45, or 45 in 100.
Why should a new display be measured for several weeks?
Show answer
So that weekly swings, unusual weekends and the novelty effect even out.
Lesson quiz · 5 questions
Score 60% or more to complete this lesson.
Create a free account to save your progress, take quizzes and earn a certificate.