
SLS-253 · Lesson 5 of 12 · 23 min
Sell-through
▶ Video coming soon A video version of this lesson is on the way.
Juniper & Pine's fall sectionals had arrived on August 17, 2026: four colourways of three styles, 64 sectionals in all. On Tuesday, October 13, eight weeks later, Noura printed a one-page report for the numbers morning. Two colourways had nearly sold out. Two had barely moved. Aiden recognized the pattern from the floor. Customers sat on the forest-green Style C, said it was beautiful, and bought the oatmeal Style B instead. "You've been watching sell-through without knowing the name for it," Bev told him. "Now let's put numbers on what you've seen."
What sell-through measures
Sell-through is the share of the merchandise available for sale that was actually sold during a period. It is the simplest and most widely used measure of how well a product is selling relative to how much of it the store bought. A sell-through of 75 in 100 over a season means three of every four units were sold; the rest are still in stock, waiting to be sold, marked down or returned to the supplier if the agreement allows.
For a new item that arrived all at once, the denominator is just the quantity received. For an item that is reordered during the season, it is the opening stock plus everything received since. Sell-through can also be calculated in retail dollars, which gives more weight to expensive items. Units are easier to understand on the floor; dollars are more useful when comparing categories with very different prices.
Retailers usually look at sell-through in two ways. Cumulative sell-through measures everything sold since the item arrived, as a share of everything received. Weekly sell-through measures one week's sales as a share of the stock available that week. Weekly figures show whether an item is speeding up or slowing down; cumulative figures show how far the season has come.
Worked problem
The fall sectionals after eight weeks
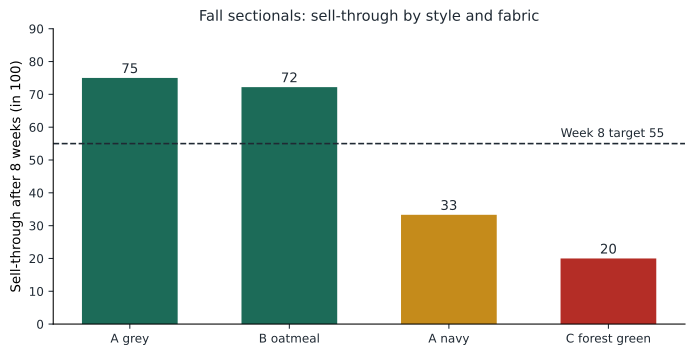
The 64 sectionals sold as follows in their first eight weeks: Style A in grey, 18 sold of 24 received; Style A in navy, 4 of 12; Style B in oatmeal, 13 of 18; Style C in forest green, 2 of 10. Find each colourway's sell-through and the total.
Show solution
- Style A grey: 18 ÷ 24 = 0.75.
- Style A navy: 4 ÷ 12 ≈ 0.333.
- Style B oatmeal: 13 ÷ 18 ≈ 0.722.
- Style C forest green: 2 ÷ 10 = 0.20.
- Total: (18 + 4 + 13 + 2) ÷ (24 + 12 + 18 + 10) = 37 ÷ 64 ≈ 0.578.
Answer: Overall sell-through was about 57.8 in 100, but the average hides two very different groups: grey and oatmeal at about 72 to 75 in 100, navy at about 33 and forest green at 20.
Comparing sell-through with a plan
A sell-through figure means little on its own. Seventy in 100 is excellent for a sofa three weeks after it arrived and poor for a seasonal item at the end of its season. Buyers compare actual sell-through with a planned sell-through curve, which says how much of the stock should have sold by each week of the season. Juniper & Pine plans its fall upholstery season over 16 weeks, from mid-August to early December, and aims for about 55 in 100 sold after eight weeks and 85 in 100 by the end, leaving a small amount of stock to carry into the holiday season.
Against that plan, the grey and oatmeal sectionals were well ahead. The navy was behind. The forest green was far behind, and at its current pace would still have most of its stock left at the end of the season.
Projecting the rest of the season
Sell-through becomes a decision tool when it is turned into a projection. The simplest projection takes the average weekly rate of sale so far and asks how long the remaining stock will last at that rate. Lesson 6 develops this idea as weeks of supply.
Worked problem
How long will each colourway last?
Using the eight-week results, estimate the weekly rate of sale for each colourway and how many weeks its remaining stock would last at that rate.
Show solution
- Style A grey: 18 ÷ 8 = 2.25 a week; 6 left; 6 ÷ 2.25 ≈ 2.7 weeks.
- Style A navy: 4 ÷ 8 = 0.5 a week; 8 left; 8 ÷ 0.5 = 16 weeks.
- Style B oatmeal: 13 ÷ 8 = 1.625 a week; 5 left; 5 ÷ 1.625 ≈ 3.1 weeks.
- Style C forest green: 2 ÷ 8 = 0.25 a week; 8 left; 8 ÷ 0.25 = 32 weeks.
Answer: Grey and oatmeal will run out in about three weeks, long before the season ends, so they are candidates to reorder. Navy will last the rest of the season and a little more. Forest green would take about 32 weeks to sell at its current pace, twice the length of the whole season.
Acting on sell-through
Each result calls for a different response, and the responses are where retail math turns into merchandising.
| Colourway | Sell-through after 8 weeks | Signal | Action agreed |
|---|---|---|---|
| Style A grey | 75 in 100 | Selling faster than planned | Reorder 12 if the supplier can deliver within four weeks |
| Style B oatmeal | about 72 in 100 | Selling faster than planned | Reorder 10; ask the supplier about a second neutral fabric |
| Style A navy | about 33 in 100 | Somewhat slow | Move to a front display with grey accessories; review in two weeks |
| Style C forest green | 20 in 100 | Very slow | Take a 20 in 100 markdown now; do not reorder; test a smaller quantity of green next fall |
The navy decision shows that a slow sell-through is not always a buying problem. Noura pointed out that the navy sectional had spent most of September in a corner behind a column, while the grey was on the main aisle. A product nobody can see cannot sell. Before taking a markdown, the group agreed to give the navy two weeks in a better location. Forest green was different: it had been on display near the entrance and customers had seen it and chosen something else. That is a clearer sign the product itself is the problem, and the lesson from the mustard chairs (lesson 3) was to act early.
When high sell-through is bad news
A sell-through close to 100 in 100 sounds like success, and often it is. But it can also mean the store bought too little. If the grey sectional sells out in week ten and the reorder takes eight weeks to arrive, the store may lose many sales in between. Customers who wanted grey may buy navy, or may walk across the street to a competitor. Lost sales do not appear on any sales report, because they never happened. A very high sell-through early in a season, especially on a basic colour that customers ask for by name, is a signal to check whether the store is about to run out.
Aiden had seen this too. Twice in early October he had shown customers the grey sectional only to find the last two in stock were already sold. One customer agreed to wait for the reorder. The other did not. Bev asked him to start recording such cases in the clienteling app, with the customer's permission, so the store would know how many sales it was losing.
Weekly sell-through and the start of a trend
Cumulative sell-through tells you where you are. Weekly sell-through tells you which way you are moving. A weekly figure is the week's unit sales divided by the stock available at the start of the week plus anything received during it.
Worked problem
Is grey slowing down?
Noura checked the grey again a week after the meeting. At the start of week nine, Juniper & Pine had 6 grey Style A sectionals in stock and received none during the week. It sold 2. In week eight, it had started with 8, received none and sold 2. Find the weekly sell-through for each week.
Show solution
- Week eight: 2 ÷ 8 = 0.25.
- Week nine: 2 ÷ 6 ≈ 0.333.
Answer: Weekly sell-through rose from 25 to about 33 in 100. Unit sales held steady at 2 a week while stock fell, so a larger share of the remaining stock is selling each week. The store needs the reorder soon.
Weekly figures are noisy in a furniture store, where a department may sell only a handful of a given item each week. A single busy Saturday can double a week's sales. Buyers look at several weeks together, or at a moving average, before acting on a weekly change.
Sell-through in dollars
For a whole department, sell-through in dollars is often more useful than units, because it weights each item by its value. The calculation is the same, using retail values instead of unit counts. For the fall sectionals, the grey and navy Style A were priced at 2,999 dollars, the oatmeal Style B at 2,799 dollars and the forest green Style C at 3,299 dollars.
Worked problem
The sectionals in dollars
Find the dollar sell-through of the fall sectionals after eight weeks, at their regular prices.
Show solution
- Sold at retail = 18 × 2,999 + 4 × 2,999 + 13 × 2,799 + 2 × 3,299 = 53,982 + 11,996 + 36,387 + 6,598 = 108,963 dollars.
- Received at retail = 24 × 2,999 + 12 × 2,999 + 18 × 2,799 + 10 × 3,299 = 71,976 + 35,988 + 50,382 + 32,990 = 191,336 dollars.
- \[\text{Dollar sell-through} = \frac{108{,}963}{191{,}336} \approx 0.569\]
Answer: Dollar sell-through was about 56.9 in 100, slightly lower than the unit figure of 57.8, because the slowest colourway is also the most expensive.
Sell-through and the sales floor
Sell-through is calculated in the office, but much of what drives it happens on the floor. Where a product is placed, how it is displayed, whether associates know its features and whether it is easy to try all affect how fast it sells. Associates also notice things that numbers miss: a cushion that customers say feels too firm, a fabric swatch that looks different in daylight, a size that does not fit through most condo doors. Bev asked each associate to bring one observation about a slow seller to the next numbers morning. "The report tells us which ones aren't selling," she said. "You can tell us why."
Basics, seasonal goods and supplier support
How sell-through is read depends on the kind of goods. For basics that are reordered all year, such as the store's best-selling mattresses or the core grey sectional, there is no end of season, and the question is whether the rate of sale is steady enough to keep stock in balance. Buyers look at sell-through over a rolling period, often four or thirteen weeks, together with weeks of supply. For seasonal goods, such as holiday décor or patio furniture, the season has a fixed end and whatever is left must be cleared, so the planned sell-through curve and the date of the first markdown matter most.
Sell-through is also the evidence buyers bring to suppliers. A supplier whose product has sold through at 20 in 100 when the store planned 55 may agree to take some stock back, exchange it for a better-selling item, or contribute markdown money, a payment or credit that offsets part of the store's markdown. Suppliers want to keep a good retail customer and to protect their brand from heavy clearance pricing. Noura's conversation with the forest-green sectional's supplier on October 14 used the lesson 5 figures: two units sold in eight weeks, while the store's other colourways had sold between 4 and 18. The supplier agreed to exchange four of the remaining eight for grey, which reduced the markdown the store had to take.
Common mistakes
MistakeJudging sell-through without a planned curve.
InsteadCompare actual sell-through with where the plan says it should be by that week.
MistakeLooking only at the department total.
InsteadBreak sell-through down by style, colour and size; averages hide winners and losers.
MistakeMarking down a slow seller before checking how it is displayed.
InsteadRule out location and presentation problems first.
MistakeCelebrating a very high sell-through without checking stock.
InsteadCheck whether you are about to run out and lose sales.
MistakeActing on one week's figures in a low-volume category.
InsteadLook at several weeks or a moving average.
Summary and key terms
- Sell-through is units sold divided by units available (opening stock plus receipts) for a period.
- Cumulative sell-through covers everything since the item arrived; weekly sell-through shows whether sales are speeding up or slowing down.
- Sell-through can also be calculated in retail dollars, which weights items by value.
- A figure means something only when compared with a planned sell-through curve for that point in the season.
- Projecting remaining stock at the current rate of sale shows which items to reorder and which to mark down.
- Slow sellers should be checked for display problems before being marked down.
- Very high sell-through can signal lost sales from running out.
- Associates' observations explain why items sell or don't.
- Sell-through
- Units (or dollars) sold as a share of units (or dollars) available for sale in a period.
- Cumulative sell-through
- Sell-through from the arrival of an item to the present.
- Weekly sell-through
- One week's sales as a share of the stock available that week.
- Planned sell-through curve
- The share of stock planned to have sold by each week of a season.
- Lost sales
- Sales that did not happen because the item was out of stock.
- Colourway
- One colour or fabric version of a style.
Practice problems
Work each problem on paper first, then reveal the answer to check.
A store received 40 dining chairs and sold 26. What is the sell-through?
Show answer
26 ÷ 40 = 0.65, or 65 in 100.
An item has 12 units left and has been selling 1.5 a week. How many weeks will they last?
Show answer
12 ÷ 1.5 = 8 weeks.
A buyer received 30 units at the start of a season and 20 more in week four, and has sold 35 by week eight. What is the cumulative sell-through?
Show answer
35 ÷ (30 + 20) = 35 ÷ 50 = 0.70, or 70 in 100.
Lesson quiz · 5 questions
Score 60% or more to complete this lesson.
Create a free account to save your progress, take quizzes and earn a certificate.