
SLS-298 · Lesson 2 of 12 · 25 min
Reading the store's numbers
▶ Video coming soon A video version of this lesson is on the way.
The decision brief for stage 2 arrives on Monday, January 11, 2027, three weeks before the season opens. It is a folder of reports: the store's 2025 profit and loss statement, the department results for 2025, and the upholstery department's month-by-month results for the spring of 2026, with traffic counts from the door counters and the sales system. Bev's instruction is short: "Tell me what these numbers say about upholstery, in one page, before you tell me what you're going to do."
Reading the numbers before acting is the habit this stage practises. A department manager who starts with ideas and then looks for numbers to support them usually ends up with a plan built on the wrong problem. A manager who reads the numbers first can see where the department is strong, where it is weak, and which levers are worth pulling.
The store in 2025
The store's profit and loss statement for 2025, from SLS-253, sets the context. Every department's results add up to these totals.
| Line | Dollars | In 100 of net sales |
|---|---|---|
| Gross sales | 12,710,000 | |
| Returns and allowances | 310,000 | |
| Net sales | 12,400,000 | 100 |
| Cost of goods sold | 7,519,000 | 60.6 |
| Gross margin | 4,881,000 | 39.4 |
| Operating expenses | 4,261,000 | 34.4 |
| Operating profit | 620,000 | 5.0 |
The store keeps 5 cents of operating profit from each dollar of sales. That is normal for a home furnishings retailer, and it means small changes matter. A department that lifts its margin by one point, or that cuts shrink in half, can change the store's profit noticeably.
The departments
| Department | Net sales (millions) | Gross margin rate (in 100) | Selling sq ft | Average inventory at cost (millions) |
|---|---|---|---|---|
| Upholstery | 3.6 | 46 | 9,000 | 0.78 |
| Case goods | 2.6 | 44 | 7,000 | 0.72 |
| Mattresses | 1.6 | 50 | 3,000 | 0.25 |
| Appliances | 3.7 | 21 | 6,500 | 0.70 |
| Décor | 0.9 | 56 | 4,500 | 0.21 |
| Store | 12.4 | 39.4 | 30,000 | 2.66 |
Worked problem
Upholstery's share of the store
What share of the store's net sales and gross margin did upholstery produce in 2025?
Show solution
- Upholstery gross margin dollars:
- \[3{,}600{,}000 \times 0.46 = 1{,}656{,}000 \text{ dollars}\]
- Share of store sales:
- \[\frac{3{,}600{,}000}{12{,}400{,}000} \approx 0.290\]
- Share of store gross margin:
- \[\frac{1{,}656{,}000}{4{,}881{,}000} \approx 0.339\]
Answer: Upholstery produced about 29 in 100 of the store's sales but about 34 in 100 of its gross margin. It earns more than its share because its margin rate, 46, is well above the store average of 39.4. Appliances sell slightly more but contribute much less margin.
This is the first finding most good numbers briefs contain: upholstery is the store's most important source of margin dollars. A one-point fall in its margin rate costs 36,000 dollars a year, more than a third of the store's shrink.
Productivity of stock and space
Sales and margin tell you how much a department earns. Stock turn, GMROI and sales per square foot tell you how hard its inventory and floor space work. SLS-253 introduced all three.
Worked problem
Turn and GMROI for upholstery
Recompute upholstery's 2025 stock turn at cost and GMROI from the department table.
Show solution
- Cost of goods sold:
- \[3{,}600{,}000 \times (1 - 0.46) = 1{,}944{,}000 \text{ dollars}\]
- Stock turn at cost:
- \[\frac{1{,}944{,}000}{780{,}000} \approx 2.49\]
- GMROI:
- \[\frac{1{,}656{,}000}{780{,}000} \approx 2.12\]
- Sales per selling square foot:
- \[\frac{3{,}600{,}000}{9{,}000} = 400 \text{ dollars}\]
Answer: Upholstery turned its stock about 2.5 times and earned 2.12 dollars of gross margin for each dollar of inventory at cost. Its turn is a little slower than the store's 2.8, but its GMROI is well above the store's 1.83: the department's strength is margin, not speed. Its sales per square foot, 400 dollars, are slightly below the store's 413.
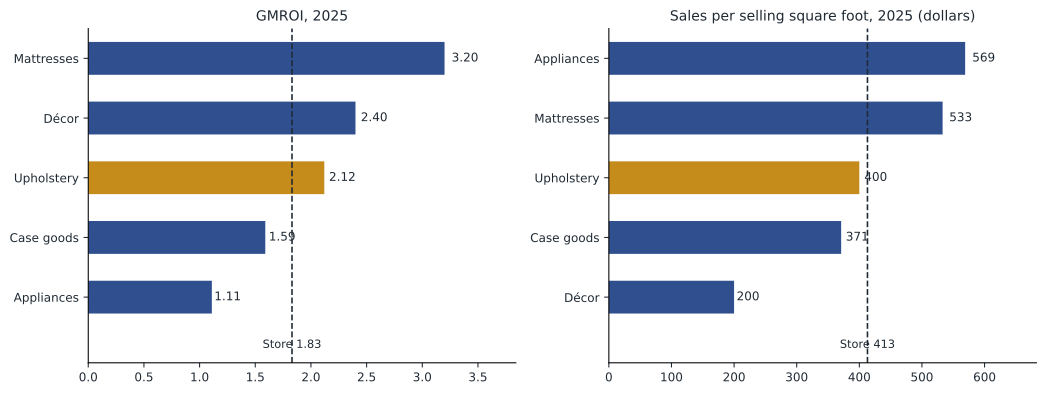
Read together, the measures say upholstery is a high-margin department with average productivity of space. It uses 30 in 100 of the selling floor and earns 29 in 100 of sales. If the department is to grow, it needs either more sales from the same space or the same sales from less stock. Bev and the owners have already decided the space will not change in 2027, so the plan has to come from sales per square foot.
The spring 2026 season
The most useful report in the folder is the upholstery department's own spring 2026 results, because spring 2027 will be compared with it month by month.
| Month | Sales (dollars) | Share of spring | Engaged groups | Transactions | Average sale (dollars) |
|---|---|---|---|---|---|
| February | 252,000 | 14.1 | 1,150 | 140 | 1,800 |
| March | 291,000 | 16.3 | 1,310 | 162 | 1,796 |
| April | 318,000 | 17.8 | 1,420 | 178 | 1,787 |
| May | 330,000 | 18.4 | 1,460 | 184 | 1,793 |
| June | 309,000 | 17.3 | 1,380 | 173 | 1,786 |
| July | 290,000 | 16.2 | 1,280 | 163 | 1,779 |
| Spring | 1,790,000 | 100 | 8,000 | 1,000 | 1,790 |
An engaged group is a party of customers who spoke with a seller in the department, counted from the sales system's greeting log and the door counter at the furniture entrance. It is a better base for conversion than all store traffic, because many people who enter the store never visit upholstery.
Worked problem
The sales equation for spring 2026
Show how engaged groups, conversion and the average sale produced the spring 2026 sales.
Show solution
- Conversion:
- \[\frac{1{,}000 \text{ transactions}}{8{,}000 \text{ groups}} = 0.125\]
- Sales:
- \[8{,}000 \times 0.125 \times 1{,}790 = 1{,}790{,}000 \text{ dollars}\]
Answer: Spring 2026 sales came from 8,000 engaged groups, a conversion of 12.5 in 100 and an average sale of 1,790 dollars. Every plan for spring 2027 has to change at least one of these three numbers, and lesson 3 decides which.
Two other figures in the spring report matter for later stages. The department sold 1,600 units in 1,000 transactions, so units per transaction were 1.6: most customers bought one large piece and some bought a chair or ottoman with it. And protection plans were sold on 22 of every 100 upholstery transactions, against a store target of 28. Jasmine attached plans to 15 in 100 of her sales, the lowest on the team; Leon attached them to 27 in 100.
From initial markup to gross margin
Upholstery's 46 in 100 gross margin is what is left after several things eat into the markup the buyer plans when the goods are bought. SLS-253 worked through the department's 2025 figures: an initial markup of 52 in 100 of retail, reductions of 9.3 in 100 of sales (markdowns 8, employee discounts 0.5 and shrink 0.8), workroom costs of 2.0 for fabric protection and small repairs, and cash discounts from suppliers worth 0.5. Each of these lines is something a department manager can influence during the season. Markdowns depend on buying the right quantities and moving slow pieces early. Shrink depends on receiving, handling and the floor. Workroom costs depend on how carefully stock is moved and delivered. That is why the season goal sheet in stage 3 sets limits for markdowns and shrink alongside the sales goal.
Worked problem
Markdowns in spring 2026
The spring 2026 markdown report shows 139,600 dollars of markdowns on 1,790,000 dollars of sales. The spring 2027 plan allows 148,000 dollars of markdowns on 1,850,000 dollars. Compare the two rates.
Show solution
- Spring 2026 markdown rate:
- \[\frac{139{,}600}{1{,}790{,}000} \approx 0.078\]
- Planned rate for spring 2027:
- \[\frac{148{,}000}{1{,}850{,}000} = 0.080\]
Answer: Markdowns were 7.8 in 100 of sales in spring 2026, and the plan allows 8.0 in 2027. The budget is slightly looser than last year, which gives room for the April promotion, but only about 8,400 dollars more in total. A promotion that cuts too deep will use up the budget before July.
Aiden added one more observation from the markdown report: more than half of spring 2026's markdowns came from two sources, the late clearance of a slow accent-chair colour and floor models that sat for more than 120 days. Both are problems that better buying and earlier action can reduce, and both come back in stages 5 and 9.
Seasonality
The share of spring sales in each month is the department's seasonal pattern. In 2026 it rose from 14 in 100 in February to a peak of 18 in 100 in May, then eased into the summer. The spring 2027 plan uses almost exactly the same shares: 260,000, 300,000, 330,000, 340,000, 320,000 and 300,000 dollars, which are 14.1, 16.2, 17.8, 18.4, 17.3 and 16.2 in 100 of the 1,850,000-dollar total. Following last year's pattern is a sensible default, but it has two consequences. Staffing must follow the same curve, and stock has to arrive before May, not during it.
Worked problem
Is the plan's pattern the same as last year?
Compare the plan's February share with spring 2026.
Show solution
- Plan share for February:
- \[\frac{260{,}000}{1{,}850{,}000} \approx 0.141\]
- Spring 2026 share for February:
- \[\frac{252{,}000}{1{,}790{,}000} \approx 0.141\]
Answer: Both are about 14.1 in 100. The plan simply scales last year's months up by about 3.4 in 100, so if the department's season shifts, for example because Easter falls earlier, the plan will not follow it. Aiden noted that Easter is on March 28 in 2027, earlier than in 2026, which could move some April sales into March.
What the numbers do not show
A good numbers brief also says what the data cannot tell you. The spring report shows sales by month but not by product, so it cannot say whether the sofa or sectional business grew. It shows engaged groups but not why some groups did not buy. And it counts protection-plan attachment but not cancellations, which Marcus's report in SLS-230 showed were high for one new seller. Aiden asked for two extra reports: sales by category and price line, and the list of special orders that were cancelled before delivery.
A third gap matters too. The reports show what the department sold, not what it could have sold. When a customer wanted a sectional in a colour that was out of stock and left, no transaction was recorded, so the lost sale is invisible in the numbers. Aiden asked the team to log "wanted but not available" requests on a simple sheet for the first four weeks of the season, so that stage 5 decisions about reorders could use them. A log like this is rough, but it is the only way to see demand that stock-outs hide.
Template: the numbers brief
| Section | What to include |
|---|---|
| Headline | One sentence on the department's position |
| Five findings | Each with the number, the comparison and why it matters |
| What the data cannot show | Gaps and the extra reports you would ask for |
| Questions for the plan | Two or three questions the season plan has to answer |
Model answer: Aiden's brief
Headline: Upholstery is the store's largest source of margin, with good stock productivity but average space productivity and a flat year behind it.
| Finding | Number | Why it matters |
|---|---|---|
| Margin leader | 34 in 100 of store margin from 29 in 100 of sales | Protecting the 46 margin rate matters more than chasing volume |
| Stock works well | GMROI 2.12 vs store 1.83 | Do not add inventory without a clear reason |
| Space is average | 400 dollars per sq ft vs store 413 | Growth has to come from more sales on the same floor |
| Flat traffic | 8,000 engaged groups in spring 2026 | Conversion and average sale are the main levers |
| Low plan attachment | 22 in 100 vs target 28; Jasmine 15 | A coaching opportunity worth about 60 plans a season |
Bev scored the brief 18 out of 20. She liked the link between findings and decisions and the request for two extra reports. She took a point off the plan-attachment finding: "Sixty plans is the right size, but show the arithmetic." (Raising attachment from 22 to 28 in 100 on 1,040 planned transactions is about 62 more plans.)
| Criterion | Excellent (4) | Developing (2) | Aiden |
|---|---|---|---|
| Accuracy | All figures correct and calculated from the sources | One or two errors | 4 |
| Selection | The five most important findings | Minor findings chosen over major ones | 4 |
| Interpretation | Each finding says why it matters | Numbers listed without meaning | 4 |
| Limits of the data | Gaps named and extra reports requested | Gaps ignored | 4 |
| Clarity and working | One page, arithmetic shown | Missing working or hard to follow | 2 |
Reflection
Which of the five findings would you have missed if you had looked only at sales? If the owners asked you to cut the department's inventory by 10 in 100, which numbers in this lesson would you use to argue for or against it?
Common mistakes
MistakeReading sales without margin.
InsteadLook at margin dollars and rate; upholstery earns more than its share of sales.
MistakeCalculating conversion on all store traffic.
InsteadUse engaged groups in the department as the base.
MistakeComparing departments only on sales per square foot.
InsteadCombine space, stock and margin measures before judging a department.
MistakeAssuming last year's monthly pattern will repeat exactly.
InsteadCheck calendar changes such as the date of Easter.
MistakePresenting a number without its comparison.
InsteadAlways give the number against last year, the plan or the store.
Summary and key terms
- Read the numbers before deciding what to do.
- Upholstery produced 29 in 100 of store sales and 34 in 100 of gross margin in 2025, with a turn of about 2.49, a GMROI of 2.12 and 400 dollars of sales per square foot.
- Spring 2026 sales were 8,000 engaged groups × 12.5 in 100 conversion × 1,790 dollars average sale = 1,790,000 dollars.
- The spring 2027 plan follows last year's seasonal pattern; Easter is earlier in 2027.
- A numbers brief gives a headline, five findings with comparisons, the limits of the data and questions for the plan.
- Engaged group
- A party of customers who spoke with a seller in the department.
- Conversion
- Transactions divided by engaged groups.
- Average sale
- Sales divided by transactions; also called average transaction value.
- Units per transaction
- Units sold divided by transactions.
- Seasonal pattern
- The share of a season's sales that falls in each month.
- Numbers brief
- A one-page summary of what a set of results means for decisions.
Practice problems
Work each problem on paper first, then reveal the answer to check.
Case goods sold 2.6 million dollars at a 44 in 100 margin with 720,000 dollars of average inventory at cost. What is its GMROI?
Show answer
Gross margin 1,144,000; 1,144,000 ÷ 720,000 ≈ 1.59.
If upholstery's margin rate fell from 46 to 45 in 100 on 3.6 million dollars of sales, how much margin would be lost?
Show answer
3,600,000 × 0.01 = 36,000 dollars.
A month has 1,400 engaged groups and 182 transactions with an average sale of 1,800 dollars. What are conversion and sales?
Show answer
182 ÷ 1,400 = 0.13 (13 in 100); 182 × 1,800 = 327,600 dollars.
Lesson quiz · 5 questions
Score 60% or more to complete this lesson.
Create a free account to save your progress, take quizzes and earn a certificate.