
SLS-298 · Lesson 3 of 12 · 26 min
Setting sales goals
▶ Video coming soon A video version of this lesson is on the way.
The decision brief for stage 3 arrives a week later, on Monday, January 18, 2027. It contains the approved season plan, the team's hours for the spring, and last spring's results by seller. Bev wants a season goal sheet: the department's targets, the drivers behind them, and a goal for each seller that adds up to the plan. "A plan is a number for the department," she says. "Goals are what each person does on Saturday."
SLS-230 explained how sales leaders set quotas from the top down and from the bottom up and then reconcile the two. A store department works the same way on a smaller scale. The owners set the top-down number, 1,850,000 dollars. The department manager builds the bottom-up view from traffic, conversion, average sale and the hours each seller will work, and checks that the two meet. If they do not, the manager either finds a credible way to close the gap or goes back to the store manager with the evidence.
From the plan to the drivers
Lesson 2 showed that spring 2026 sales came from 8,000 engaged groups, a conversion of 12.5 in 100 and an average sale of 1,790 dollars. To reach 1,850,000 dollars in 2027 at least one of these has to change. The question is which change is realistic.
| Driver | Spring 2026 | Option A: more traffic | Option B: better conversion | Option C: higher average sale |
|---|---|---|---|---|
| Engaged groups | 8,000 | 8,270 | 8,000 | 8,000 |
| Conversion (in 100) | 12.5 | 12.5 | 12.92 | 12.5 |
| Average sale (dollars) | 1,790 | 1,790 | 1,790 | 1,850 |
| Sales (dollars) | 1,790,000 | 1,850,000 (about) | 1,850,000 (about) | 1,850,000 |
Each option on its own is possible, but each has a weakness. Option A depends on marketing and the season, which the department does not control. Option C works against the new 999-dollar sofa price line, which is meant to bring in buyers who would otherwise leave, and will pull the average sale down rather than up. Option B, better conversion, is the driver a department team controls most directly, through greeting, discovery, the floor checklist and follow-up.
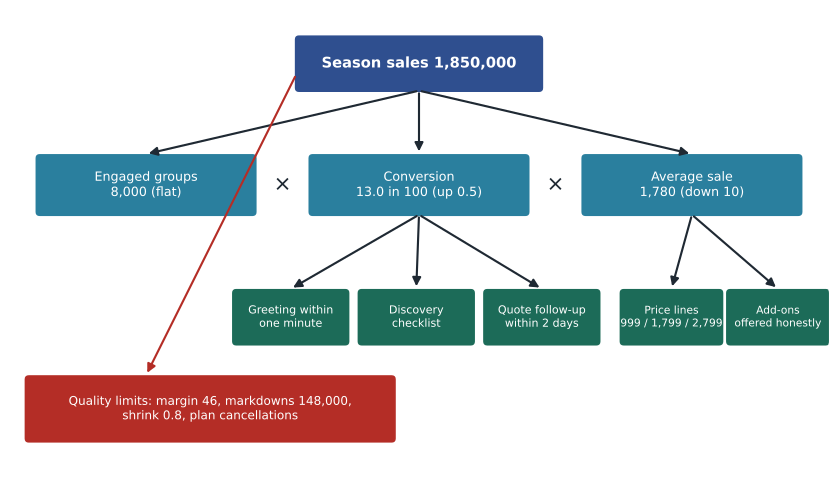
Aiden chose a combination. He planned flat traffic, because the store's marketing budget was unchanged; a conversion of 13.0 in 100, half a point better than last year, from coaching and faster follow-up on quotes; and an average sale of 1,780 dollars, 10 dollars lower than last year, because the new price line would add smaller sales.
Worked problem
Does the combination reach the plan?
Check Aiden's drivers: 8,000 engaged groups, 13.0 in 100 conversion and an average sale of 1,780 dollars.
Show solution
- Transactions:
- \[8{,}000 \times 0.130 = 1{,}040\]
- Sales:
- \[1{,}040 \times 1{,}780 = 1{,}851{,}200 \text{ dollars}\]
Answer: The combination gives 1,851,200 dollars, just above the plan. The goal sheet records the three drivers as department goals: 1,040 transactions from about 8,000 engaged groups at an average sale of 1,780 dollars.
Worked problem
How sensitive is the plan?
The door counters show that traffic to the furniture entrance fell 3 in 100 in January 2027. If engaged groups are 3 in 100 below plan for the whole season and the average sale holds at 1,780 dollars, what conversion would the department need?
Show solution
- Engaged groups at 3 in 100 below plan:
- \[8{,}000 \times 0.97 = 7{,}760\]
- Conversion needed:
- \[\frac{1{,}850{,}000}{7{,}760 \times 1{,}780} \approx 0.1339\]
Answer: The department would need a conversion of about 13.4 in 100, nearly a full point above last year. That is possible but demanding. Aiden added a line to the goal sheet: "If traffic is more than 2 in 100 below plan by the end of March, review the plan with Bev." A good goal sheet says in advance what will trigger a review.
Quality goals beside the sales goal
A department that hits its sales goal by discounting, by selling protection plans that customers later cancel, or by letting stock walk out of the back door has not had a good season. The goal sheet therefore sets limits on how the sales are made. SLS-230 called these guardrails.
| Goal | Target for spring 2027 | Basis |
|---|---|---|
| Gross margin | 851,000 dollars (46 in 100) | Season plan |
| Markdowns | No more than 148,000 dollars (8.0 in 100) | Season plan |
| Shrink | No more than 0.8 in 100 of sales (about 14,800 dollars) | 2025 department rate |
| Protection-plan attachment | 28 in 100 of transactions | Store target |
| Protection-plan cancellations within 30 days | No more than 5 in 100 of plans sold | Store average 4.1 (SLS-230) |
| Customer satisfaction after delivery | At least 90 in 100 of responses 4 or 5 out of 5 | Spring 2026: 87 in 100 |
The cancellation goal matters because it protects against the wrong kind of selling. Marcus's report in SLS-230 found that one new seller's plans were cancelled at 17.5 in 100, far above Carl's 2.5. A seller who pushes plans hard will raise attachment and cancellations at the same time. Setting both targets together tells the team that attachment only counts if customers keep what they bought.
Worked problem
What is the attachment goal worth?
The plan has 1,040 transactions. Spring 2026 attachment was 22 in 100. How many more plans does the 28 in 100 goal mean?
Show solution
- Plans at 22 in 100:
- \[1{,}040 \times 0.22 \approx 229\]
- Plans at 28 in 100:
- \[1{,}040 \times 0.28 \approx 291\]
- Difference:
- \[291 - 229 = 62\]
Answer: The goal means about 62 more plans in the season. That is about two or three more plans a week across the whole team, which is realistic if each seller offers the plan on every eligible sale, and the cancellation guardrail stops it turning into pressure.
From the department to each seller
The department goal has to be shared out fairly. Splitting it equally ignores the fact that sellers work different hours; splitting it purely by hours ignores the fact that a new seller sells less per hour while learning. Aiden used weighted selling hours: each person's scheduled selling hours for the season multiplied by a productivity factor agreed with Bev.
| Seller | Weekly selling hours | Weeks selling | Factor | Weighted hours |
|---|---|---|---|---|
| Jasmine Kaur | 37.5 | 26 | 1.1 | 1,072.5 |
| Leon Fournier | 37.5 | 26 | 1.0 | 975 |
| Mei Wong | 24 | 26 | 1.0 | 624 |
| Aiden Laroque | 20 | 26 | 0.9 | 468 |
| Dylan Redcloud | 20 | 24 | 0.6 | 288 |
| Total | 3,427.5 |
The factors were based on last spring's sales per hour. Jasmine sold about 10 in 100 more per hour than the team average because of her custom orders. Aiden's factor is 0.9 because his lead duties interrupt his selling. Dylan's first two weeks are training, so he sells for 24 weeks, and his factor of 0.6 is an average across a season in which he starts slowly and improves.
Worked problem
Each seller's goal
Share the 1,850,000-dollar plan in proportion to weighted hours.
Show solution
- Sales per weighted hour:
- \[\frac{1{,}850{,}000}{3{,}427.5} \approx 539.75 \text{ dollars}\]
- Jasmine:
- \[1{,}072.5 \times 539.75 \approx 578{,}900\]
- Leon:
- \[975 \times 539.75 \approx 526{,}300\]
- Mei:
- \[624 \times 539.75 \approx 336{,}800\]
- Aiden:
- \[468 \times 539.75 \approx 252{,}600\]
- Dylan:
- \[288 \times 539.75 \approx 155{,}400\]
Answer: Rounded, the goals are 579,000 dollars for Jasmine, 526,000 for Leon, 337,000 for Mei, 253,000 for Aiden and 155,000 for Dylan. They add up to 1,850,000. Each seller also receives a weekly pace figure and the same quality goals as the department.
Aiden discussed each goal with the person before the sheet went to Bev. Leon thought his goal was high because he usually sold in-stock sofas at lower prices. Aiden agreed to pair him with Jasmine on two custom orders in February so he could learn the process, and they agreed to look at his pace together at the end of March rather than change the number now. Mei asked whether Saturdays with Carl on the floor would take sales from her; Aiden explained that Carl's occasional upholstery sales counted toward the department goal but not toward anyone's personal goal, and that the up system still applied.
Phasing goals through the season
A season goal divided by 26 weeks gives a flat weekly figure, but the department's sales are not flat: February carries about 14 in 100 of the season and May about 18. A seller compared with a flat pace will look behind in February and ahead in May even if they are doing exactly what the plan expects. Aiden therefore phased each person's goal by the same monthly shares as the department plan.
Worked problem
Jasmine's February pace
Jasmine's season goal is 579,000 dollars. February is 260,000 of the department's 1,850,000 dollars and has four weeks. What is her February goal and weekly pace, and how does it compare with a flat pace?
Show solution
- February share:
- \[\frac{260{,}000}{1{,}850{,}000} \approx 0.1405\]
- Jasmine's February goal:
- \[579{,}000 \times 0.1405 \approx 81{,}400 \text{ dollars}\]
- Weekly pace in February:
- \[\frac{81{,}400}{4} \approx 20{,}350 \text{ dollars}\]
- Flat weekly pace:
- \[\frac{579{,}000}{26} \approx 22{,}270 \text{ dollars}\]
Answer: Her February pace is about 20,350 dollars a week, almost 2,000 dollars below the flat figure. Using the phased pace avoids telling her she is behind in a month when the whole department is expected to be quieter.
Leading and lagging goals
Sales and margin are lagging measures: they show results after the fact. A seller who is behind on sales in March cannot fix it by trying harder in July. The goal sheet therefore also sets leading goals, behaviours that predict sales and that the seller controls every day.
| Leading goal | Target | Why it leads to sales |
|---|---|---|
| Greeting within one minute of entering the department | At least 85 in 100 of groups | Unacknowledged groups often leave (SLS-250) |
| Discovery checklist used on every sit-down conversation | Every time | Better discovery means better recommendations |
| Written quote given when a customer leaves without buying | At least 70 in 100 of conversations | A quote gives the customer something to discuss at home |
| Follow-up on quotes within two days, with consent | Every quote | Many big-ticket buyers return on a second visit (SLS-256) |
| Protection plan offered on every eligible sale | Every time | Offering is the seller's job; the customer decides |
Making goals motivating rather than stressful
SLS-230 described the research on goals: specific, challenging goals usually produce better performance than "do your best", but only if people accept them, have the skill to reach them and get feedback on progress. The goal sheet supports all three. Goals were discussed before they were set, the coaching plan in stage 7 gives each seller help with the skill they most need, and a weekly pace report shows where each person stands.
Aiden also kept the recognition simple and fair. Following the store's holiday contest in SLS-230, he proposed a reward for beating one's own pace by 10 in 100 in any month, rather than a prize for the top seller, so that Dylan could earn it as easily as Jasmine. Bev approved it with a budget of 300 dollars for the season.
Template: the season goal sheet
| Section | What to include |
|---|---|
| Department goals | Sales, margin and the three drivers, with the arithmetic |
| Quality goals | Markdowns, shrink, plan attachment and cancellations, satisfaction |
| Seller goals | Weighted-hours table and each person's season and weekly goals |
| Leading goals | Daily behaviours and targets |
| Review triggers | What will cause the goals to be reviewed, and when |
| Recognition | How progress will be recognized, and the budget |
Model answer and Bev's scoring
Aiden's goal sheet contained the driver table, the guardrails, the weighted-hours split, the leading goals and two review triggers: traffic more than 2 in 100 below plan by the end of March, and markdowns above 60 in 100 of the budget by the end of April. Bev scored it 18 out of 20. She took one point from the seller goals because Aiden had not allowed for vacation: Jasmine had a week booked in June, so her goal should be reduced by about one twenty-sixth and the difference shared out. She took another from the leading goals because "every time" is not measurable unless someone checks it, and asked how he would know.
| Criterion | Excellent (4) | Developing (2) | Aiden |
|---|---|---|---|
| Driver analysis | Drivers chosen and justified from the numbers | Drivers stated without justification | 4 |
| Arithmetic | Goals add up to the plan, working shown | Errors or totals that do not match | 4 |
| Fairness of seller goals | Hours, experience and absences reflected | Equal split or hours only | 3 |
| Guardrails and leading goals | Measurable and balanced | Missing or not measurable | 3 |
| Review and recognition | Clear triggers and a fair, budgeted reward | Missing | 4 |
Reflection
Would you have set the conversion goal at 13.0 in 100, or would you have relied on traffic? How would you respond if a seller told you their goal was unfair after the season had started?
Common mistakes
MistakeSetting only a sales goal.
InsteadAdd guardrails for margin, markdowns, shrink, cancellations and satisfaction.
MistakeDividing the plan equally among sellers.
InsteadUse weighted selling hours that reflect hours, experience and absences.
MistakeChoosing a driver the team cannot influence.
InsteadPrefer drivers such as conversion that daily behaviour changes.
MistakeAnnouncing goals without discussing them.
InsteadDiscuss each goal with the person before it is final.
MistakeWaiting until the end of the season to review.
InsteadSet review triggers in advance.
Summary and key terms
- Reconcile the top-down plan with a bottom-up view built from engaged groups, conversion and average sale.
- Aiden's drivers, 8,000 groups at 13.0 in 100 and 1,780 dollars, give 1,851,200 dollars.
- Guardrails limit markdowns, shrink and plan cancellations and set a satisfaction target.
- Seller goals come from weighted selling hours: 579,000, 526,000, 337,000, 253,000 and 155,000 dollars.
- Leading goals turn the plan into daily behaviours, and review triggers say when to look again.
- Top-down goal
- A target set by owners or senior managers.
- Bottom-up view
- A forecast built from drivers and capacity.
- Guardrail
- A limit that protects quality while a sales goal is pursued.
- Weighted selling hours
- Selling hours multiplied by a productivity factor, used to share a goal.
- Leading measure
- A behaviour or activity that predicts later results.
- Lagging measure
- A result, such as sales, that is known only after the fact.
Practice problems
Work each problem on paper first, then reveal the answer to check.
With 8,000 engaged groups and a conversion of 13.0 in 100, what average sale would give exactly 1,850,000 dollars?
Show answer
1,850,000 ÷ 1,040 ≈ 1,778.85 dollars.
Jasmine takes one week of vacation. Her weighted hours fall by 37.5 × 1.1 = 41.25. What is her new goal at 539.75 dollars per weighted hour?
Show answer
(1,072.5 − 41.25) × 539.75 ≈ 556,600 dollars; the 22,300 difference is shared among the others.
Why set a cancellation limit next to a protection-plan attachment goal?
Show answer
So attachment cannot be raised by pressure that leads customers to cancel.
Lesson quiz · 5 questions
Score 60% or more to complete this lesson.
Create a free account to save your progress, take quizzes and earn a certificate.