
SLS-221 · Lesson 10 of 12 · 23 min
Inside sales metrics
▶ Video coming soon A video version of this lesson is on the way.
On Friday, November 6, after her weekly numbers session with Grace Liu, Maya stayed for the inside team's monthly review of October with Owen and Grace. Grace had prepared a one-page dashboard. "Inside teams generate more numbers than anyone else in sales," she said. "Every dial, email and chat is logged. The danger isn't having too little data. It's measuring the easy things and missing the ones that matter." She walked through the October figures from the top of the page to the bottom.
SLS-214 covered sales analytics for the whole sales team: conversion, velocity, win rates, quotas and forecasts. This lesson focuses on the measures particular to inside sales: activity, connection and conversation rates, meetings and their quality, pipeline sourced by the team, response times, cost per meeting and how reps ramp up. It uses Ridgeline's October 2026 numbers throughout.
From activity to pipeline
Inside sales metrics form a chain, from activity at the top to pipeline and revenue at the bottom. Each step is a rate that connects one count to the next. Grace's October dashboard showed the outbound chain for the whole team.
| Step | October count | Rate from previous step |
|---|---|---|
| Dials | 2,180 | |
| Connects (a person answered) | 214 | 214 ÷ 2,180 ≈ 9.8 in 100 |
| Conversations (more than a brush-off) | 131 | 131 ÷ 214 ≈ 61 in 100 |
| Meetings booked | 49 | 49 ÷ 131 ≈ 37 in 100 |
| Meetings held | 42 | 42 ÷ 49 ≈ 86 in 100 |
| Meetings accepted by AEs | 34 | 34 ÷ 42 ≈ 81 in 100 |
| Opportunities created (by November 13) | 24 | 24 ÷ 34 ≈ 71 in 100 |
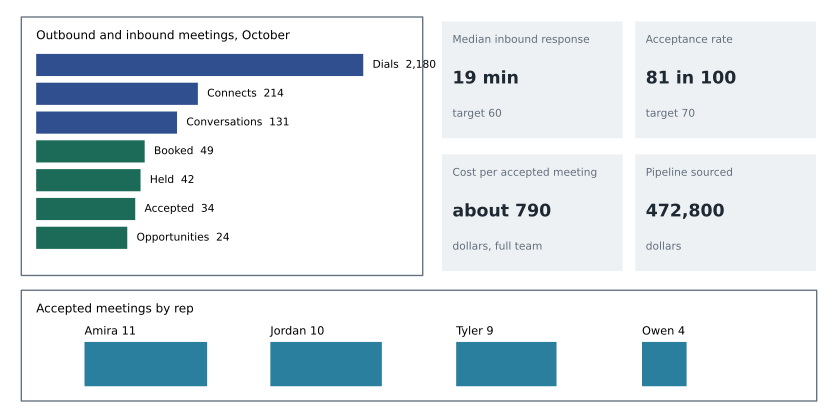
The chain helps diagnose problems. A team with plenty of conversations but few meetings needs to work on its asks and its value proposition. A team with many meetings booked but few accepted needs to qualify better. A team that books good meetings but whose opportunities rarely close may be targeting the wrong accounts, or its AEs may need coaching. Looking at only one number, such as dials, hides all of this.
Quality measures
Quality measures check that activity is turning into something the business values. The most important at Ridgeline were the acceptance rate, the share of held meetings that AEs accepted as qualified (lesson 2), and the meeting-to-opportunity rate, the share of accepted meetings that became opportunities in the CRM. October's acceptance rate of 81 in 100 was up from 70 in September, which Grace attributed partly to the inside team asking about timelines more consistently and partly to chance, since one month's figures move around.
Two quality measures warned of problems. The no-show rate, meetings booked but not held, ran at 7 of 49, about 14 in 100. Most no-shows were meetings booked more than ten days ahead, so Owen asked the team to book meetings within a week where possible and to send a short reminder the day before. And Grace tracked removal requests per thousand emails sent, which had fallen after the team stopped using purchased lists in September, as SLS-140 described.
Pipeline sourced
The output that matters most to the business is pipeline sourced: the value of opportunities that began with the inside team's work. It connects the team's activity to the revenue the field AEs will eventually close.
Worked problem
Pipeline and expected bookings from October's meetings
The 24 opportunities created from the inside team's October meetings had a total estimated first-year value of 472,800 dollars. Ridgeline's win rate for opportunities over the previous two quarters was about 24 in 100 (SLS-214), and its median sales cycle about 70 days. What is the average opportunity value, how much first-year revenue can Ridgeline expect from these opportunities, and roughly when?
Show solution
- Average opportunity value.
- \[\frac{472{,}800}{24} = 19{,}700 \text{ dollars}\]
- Expected first-year revenue at a 24 in 100 win rate.
- \[472{,}800 \times 0.24 = 113{,}472 \text{ dollars}\]
- With a median cycle of about 70 days from late October and early November, most of these deals would be decided in January and February 2027, the second and third months of Ridgeline's first fiscal quarter.
Answer: The average opportunity is 19,700 dollars, close to Ridgeline's average win in the third quarter. At a 24 in 100 win rate, the team can expect about 113,000 dollars of first-year revenue from October's meetings, mostly in early 2027. These are estimates, not bookings; Grace reported them separately from the forecast in SLS-214.
Cost per meeting and return on the team
Inside teams cost money: salaries, commissions, software and management time. Dividing that cost by the meetings the team produces gives a cost per accepted meeting, a useful number for deciding how big the team should be and whether a channel such as paid advertising or events produces meetings more cheaply.
Worked problem
Cost per accepted meeting
Ridgeline estimates the inside team's monthly cost, including salaries, benefits, variable pay, software licenses and a share of Owen's time spent managing, at about 26,900 dollars. In October the team produced 34 accepted meetings for field AEs. It also closed 6 small deals itself, worth 21,400 dollars in first-year revenue, and handled inbound chats and calls. If Owen's estimate is that about 75 in 100 of the team's cost goes to producing AE meetings, what is the cost per accepted meeting? Compare it with the expected revenue per accepted meeting.
Show solution
- Cost attributed to AE meetings.
- \[26{,}900 \times 0.75 = 20{,}175 \text{ dollars}\]
- Cost per accepted meeting.
- \[\frac{20{,}175}{34} \approx 593 \text{ dollars}\]
- Expected first-year revenue per accepted meeting, from the previous example.
- \[\frac{113{,}472}{34} \approx 3{,}337 \text{ dollars}\]
- Ratio of expected revenue to cost.
- \[\frac{3{,}337}{593} \approx 5.6\]
Answer: Each accepted meeting cost about 593 dollars of inside-team effort and is expected to produce about 3,337 dollars of first-year revenue, about 5.6 times its cost, before counting the AEs' own time and the margin on the sale. Without the 75 in 100 attribution, the full team cost would give about 791 dollars per meeting, the figure shown on Grace's dashboard. Either way the team pays for itself many times over, but Grace was careful to say how the cost had been split.
Attribution choices like the 75 in 100 split are judgment calls. Grace showed both figures on the dashboard so nobody could accuse the inside team of flattering itself, and noted that the small deals the team closed on its own, 21,400 dollars in October, were an extra return not counted in the meeting figures.
Inbound measures
For inbound work, the key measures are about speed and conversion. In October, Ridgeline received 31 quote requests in business hours. The median time to a personal response was 19 minutes, and 28 of the 31, about 90 in 100, met the one-hour target, an improvement on September after the escalation rule in lesson 3. Of the 31 requests, 4 were disqualified (two students, one competitor, one wrong company), 17 led to a held call or meeting and 9 had become opportunities or small deals by November 13.
Per-rep measures and fairness
Grace also showed accepted meetings by rep: Amira 11, Jordan 10, Tyler 9 and Owen 4. These numbers are easy to misread. Amira worked mostly inbound leads, which convert more easily than outbound. Owen spent much of his time managing and closing small deals. Tyler's territory of clinics and schools had longer decision processes than Jordan's professional firms. Comparing reps fairly means comparing like with like: outbound reps with each other, on similar account lists, over a period long enough to smooth out luck, usually a quarter.
Owen also watched each rep's activity mix rather than total activity. A rep whose dials rose sharply while conversations stayed flat was probably calling poor lists or rushing. A rep with few dials but many conversations was probably researching well and calling at good times. He coached on the ratios, not on the raw counts.
Ramp time
New inside reps take time to reach full productivity. Ramp time is the period from a rep's start date until they consistently produce at the expected level. At Ridgeline, an experienced inside rep produced about 10 accepted meetings a month. A new hire was expected to reach about 3 in the first month, 6 in the second and 9 in the third, and to reach full productivity by the fourth.
Worked problem
The cost of ramp time
Using Ridgeline's ramp expectations of 3, 6 and 9 accepted meetings in a new rep's first three months, against 10 a month for an experienced rep, how many accepted meetings does a new rep produce in the first quarter, and how many fewer than an experienced rep?
Show solution
- New rep in the first three months.
- \[3 + 6 + 9 = 18\]
- Experienced rep over the same three months.
- \[10 \times 3 = 30\]
- Shortfall.
- \[30 - 18 = 12 \text{ meetings}\]
- At about 3,337 dollars of expected first-year revenue per accepted meeting, the shortfall is worth roughly:
- \[12 \times 3{,}337 \approx 40{,}000 \text{ dollars}\]
Answer: A new rep produces about 18 accepted meetings in the first quarter, 12 fewer than an experienced rep, worth roughly 40,000 dollars of expected first-year revenue. That is one reason teams invest in onboarding and why losing an experienced rep costs much more than their salary.
Using metrics well
Grace ended the review with the cautions from SLS-214. Activity targets invite gaming, so she paired every activity measure with a quality measure. Monthly figures are noisy, so she looked at three-month trends before drawing conclusions. And the purpose of the dashboard was to decide what to do next. October's actions were specific: book meetings within a week to reduce no-shows, keep the escalation rule, and test video on the day 10 touch with larger groups, as lesson 6 described.
Looking ahead: next quarter's meetings
Most inside measures describe the past month. Grace added one forward-looking measure to the dashboard: meetings scheduled ahead, the number of accepted-quality meetings already booked for the coming weeks. Because the field team's pipeline for a quarter depends on meetings held early in that quarter, a low number of meetings booked ahead in late November warned of a weak first quarter before it began.
Worked problem
Are enough meetings booked for December?
Ridgeline's plan for the first quarter of fiscal 2027 (December to February) called for the inside team to deliver about 40 accepted meetings a month to the field team. On November 13, the team had 22 meetings already booked for December. At October's rates, about 86 in 100 of booked meetings are held and 81 in 100 of held meetings are accepted. How many accepted meetings do the 22 bookings represent, and how many more bookings does the team need for December?
Show solution
- Expected accepted meetings from current bookings.
- \[22 \times 0.86 \times 0.81 \approx 15.3\]
- Accepted meetings still needed.
- \[40 - 15.3 = 24.7\]
- Bookings needed to produce 24.7 accepted meetings.
- \[\frac{24.7}{0.86 \times 0.81} = \frac{24.7}{0.697} \approx 35.4\]
Answer: The 22 bookings should produce about 15 accepted meetings, so the team needs about 36 more December bookings to reach 40, about 9 a week through the rest of November and the first weeks of December. Owen used the figure to plan an extra calling block each week for Jordan and Tyler.
December also has fewer working days and holiday absences on both sides, so Grace warned that the no-show rate would probably rise. She suggested treating 40 accepted meetings as a stretch target for December and planning to recover any shortfall in January, when offices return from the holidays and budgets reset.
Common mistakes
MistakeJudging the inside team on dials alone.
InsteadTrack the whole chain from activity to accepted meetings and pipeline sourced.
MistakeComparing inbound and outbound reps directly.
InsteadCompare like with like over a long enough period, usually a quarter.
MistakeTreating pipeline sourced as revenue.
InsteadApply the win rate and timing to estimate expected revenue, and report it separately.
MistakeHiding how costs were attributed.
InsteadShow the assumptions, such as the share of cost assigned to AE meetings.
MistakeIgnoring ramp time when planning hires.
InsteadPlan for new reps to take about three months to reach full productivity.
Summary and key terms
- Inside sales metrics form a chain from dials and connects through conversations and meetings to accepted meetings, opportunities and pipeline.
- In October 2026, Ridgeline's inside team went from 2,180 dials to 34 accepted meetings and 24 opportunities worth 472,800 dollars, which at a 24 in 100 win rate means about 113,000 dollars of expected first-year revenue.
- Quality measures such as acceptance and no-show rates check that activity is worth something.
- Cost per accepted meeting was about 593 dollars on Owen's attribution, against about 3,337 dollars of expected revenue.
- Compare reps fairly, watch activity mix and plan for about three months of ramp time.
- Connect rate
- The share of dials that reach a person.
- Acceptance rate
- The share of held meetings that AEs accept as qualified.
- No-show rate
- The share of booked meetings that do not take place.
- Pipeline sourced
- The value of opportunities that began with a team's work.
- Cost per accepted meeting
- The cost of producing meetings divided by the number of accepted meetings.
- Ramp time
- The time a new rep takes to reach full productivity.
- Activity mix
- The balance of a rep's activities and the ratios between them.
Practice problems
Work each problem on paper first, then reveal the answer to check.
A team booked 40 meetings, held 35 and had 28 accepted. What are the no-show and acceptance rates?
Show answer
No-show 5 ÷ 40 = 12.5 in 100; acceptance 28 ÷ 35 = 80 in 100.
Opportunities worth 300,000 dollars and a win rate of 25 in 100 give what expected revenue?
Show answer
300,000 × 0.25 = 75,000 dollars.
A team costs 24,000 dollars a month, 80 in 100 of it spent on meetings, and produces 30 accepted meetings. What is the cost per accepted meeting?
Show answer
24,000 × 0.80 = 19,200; 19,200 ÷ 30 = 640 dollars.
Lesson quiz · 5 questions
Score 60% or more to complete this lesson.
Create a free account to save your progress, take quizzes and earn a certificate.