
ITIL-140 · Lesson 3 of 12 · 30 min
Incident management I: logging, categorizing and prioritizing
Incident management is the practice users notice most when things go wrong. Its purpose, in plain words, is to minimize the negative impact of incidents by restoring normal service operation as quickly as possible. This lesson covers the first half of the incident lifecycle: detecting and logging incidents, categorizing them, and deciding how urgently they must be handled. Lesson 4 covers diagnosis, resolution, major incidents and newer ways of organizing the work.
What counts as an incident
ITIL defines an incident as an unplanned interruption to a service or a reduction in the quality of a service. Both halves matter. An application that is completely unavailable is an incident, but so is one that works slowly, produces wrong results intermittently or is available only to some users. A failure of a component that has not yet affected users, such as one disk in a redundant array, is often also treated as an incident because, left unaddressed, it reduces resilience and may soon affect service. Many organizations log such failures as incidents so they are tracked to resolution.
Some things that look like incidents are not. A user asking how to use a feature is making a request for information. A user who wants a new feature has a demand or change request. A planned outage announced in advance is not an incident, though overrunning it would be. Distinguishing these at the start keeps incident data clean and stops routine work from being treated as an emergency.
| Situation | Incident? | Why |
|---|---|---|
| The HR portal returns an error for all users | Yes | Unplanned interruption |
| Reports take 3 minutes to load instead of 10 seconds | Yes | Reduction in quality |
| One power supply in a redundant pair fails; users unaffected | Usually logged as one | Reduced resilience may soon affect service |
| A user asks how to export a report to a spreadsheet | No | Request for information |
| A scheduled maintenance window runs as planned | No | Planned, communicated activity |
| The maintenance window overruns by two hours | Yes | The overrun is unplanned |
The incident lifecycle
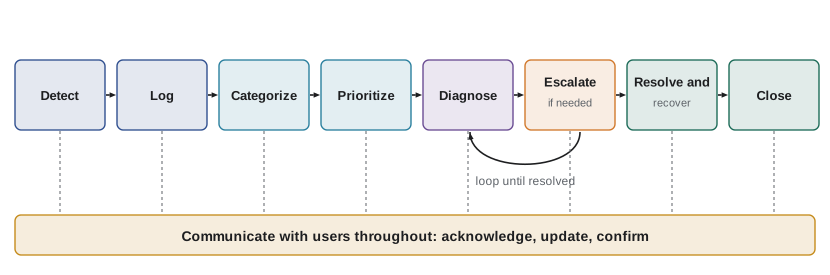
ITIL 4 does not prescribe a single incident process. Organizations design their own workflows to suit their services. Most workflows share common stages: detection, logging, categorization, prioritization, initial diagnosis, escalation if needed, investigation and diagnosis, resolution and recovery, and closure. Communication with affected users runs throughout. The stages need not be strictly sequential. A service desk agent might log, categorize, prioritize and resolve a simple incident in two minutes; a complex incident might loop through diagnosis and escalation several times.
Detection and logging
Incidents are detected in two main ways. Users report them, usually through the service desk. Monitoring tools detect them, sometimes before users notice. The share of incidents detected by monitoring before users report them is a key indicator of how mature a provider is. Lesson 9 covers monitoring and event management in detail. Suppliers may also notify the provider of incidents affecting their services, and technical staff may notice problems during routine work.
Every incident should be logged, however small. Logging creates a record of the impact, enables tracking against targets and provides the data that problem management needs to find patterns. An incident resolved informally without a record is invisible: nobody can count it, learn from it or see that it has happened twenty times this month. A good incident record captures the time of detection, who reported it, the affected service and configuration items, symptoms, impact, actions taken, and links to related incidents, problems and changes.
| Field | Why it matters |
|---|---|
| Time detected and time logged | Measures detection and response delays |
| Reporter and affected users | Allows updates and shows the scale of impact |
| Affected service and configuration item | Links to service level targets and to configuration data |
| Symptoms and error messages | Supports diagnosis and matching to known errors |
| Impact and urgency | Determines priority |
| Category | Routes work and enables trend analysis |
| Actions, assignments and timestamps | Creates an audit trail and measures each step |
| Resolution and closure code | Supports learning and reporting |
| Links to problems, changes and other incidents | Connects incident data to the wider system |
Categorization
Categorization groups incidents by type so they can be routed to the right people and analysed later. Common schemes categorize by service affected (email, payroll, customer portal), by component or technology (network, database, laptop), or by symptom (cannot log in, slow performance, error message). Many organizations use two or three levels, such as service, then component, then symptom.
Category schemes are easy to overcomplicate. A scheme with hundreds of options leads agents to pick whatever is first in the list or a vague catch-all, which makes the data useless. A scheme with too few options cannot route work or reveal trends. The best schemes are short, reflect how users and resolvers think about services, are reviewed regularly against how they are actually used, and distinguish the category at logging from the category at closure, because the true cause is often clearer by the end.
Worked problem
Spotting a weak category scheme
A provider reviews 5,000 incidents from the last quarter. 2,100 are categorized as "Other", 900 as "Software – general" and the remaining 2,000 are spread across 140 specific categories. What does this suggest, and what should the provider do?
Show solution
- Share in vague categories: (2,100 + 900) ÷ 5,000 = 60 %.
- With 140 specific categories holding only 2,000 incidents, most hold very few records and the list is probably too long to use quickly.
- Action: analyse a sample of "Other" records to discover the real groupings, shrink the specific list to the 20 or 30 that cover most incidents, and add a closure category so resolvers can correct the initial guess.
Answer: Sixty per cent of incidents are effectively uncategorized. The scheme is both too long and missing the categories people need; simplify and rebuild it from actual data.
Impact and urgency
Priority tells everyone how quickly an incident must be handled relative to others. Most organizations derive priority from two factors. Impact measures the effect on the business: how many users, how critical the service, how much money or reputation at stake, whether safety or legal obligations are involved. Urgency measures how quickly the business needs resolution: whether a workaround exists, whether there is a deadline, whether the impact is growing.
The two are independent. A failed printer in a large office has low impact but may be urgent if a contract must be printed for a meeting in an hour. A slow-running nightly report that will be needed next week may have high impact if it feeds regulatory filings but low urgency today. Combining them in a matrix gives a consistent priority that does not depend on who shouts loudest.
| Impact \ Urgency | High urgency | Medium urgency | Low urgency |
|---|---|---|---|
| High impact | Priority 1 (critical) | Priority 2 (high) | Priority 3 (medium) |
| Medium impact | Priority 2 (high) | Priority 3 (medium) | Priority 4 (low) |
| Low impact | Priority 3 (medium) | Priority 4 (low) | Priority 5 (planning) |
The matrix only works if impact and urgency are defined clearly. Vague labels such as "high" invite inflation, because every user believes their issue is important. Good definitions are concrete. High impact might mean a whole site, more than 100 users, a service on the critical list or any threat to safety. High urgency might mean no workaround and work completely stopped. Published definitions also help users understand why their issue is not top priority.
| Level | Example impact definition | Example urgency definition |
|---|---|---|
| High | A critical service is down, or more than 100 users or a whole site are affected, or there is a safety, legal or major financial risk | No workaround; work has stopped; a business deadline is imminent |
| Medium | A department or 10 to 100 users affected, or a non-critical service down | A workaround exists but is inconvenient; impact may grow |
| Low | One user or a few users affected with limited business effect | A workaround exists and the user can continue working |
Priority targets
Each priority comes with targets, usually agreed through service level management. A response target says how quickly someone must start working on the incident; a resolution target says how quickly service must be restored. Targets may run on business hours or on calendar hours. A priority 1 incident on a 24-hour service usually runs on calendar time, while a priority 4 incident might count only business hours. The resulting due time is what agents and tools track.
| Priority | Response target | Resolution target | Clock |
|---|---|---|---|
| P1 critical | 15 minutes | 4 hours | Calendar, 24 × 7 |
| P2 high | 30 minutes | 8 hours | Calendar, 24 × 7 |
| P3 medium | 2 business hours | 3 business days | Business hours |
| P4 low | 1 business day | 5 business days | Business hours |
| P5 planning | 2 business days | Agreed with the user | Business hours |
The code below implements the priority matrix and calculates due times. For simplicity, P1 and P2 run on calendar time and P3 and P4 count business hours from 08:00 to 17:00, Monday to Friday, ignoring public holidays. Real tools also handle holidays, time zones and clocks that pause while waiting for the user.
from datetime import datetime, timedelta

MATRIX = {("high", "high"): 1, ("high", "medium"): 2, ("high", "low"): 3,
          ("medium", "high"): 2, ("medium", "medium"): 3, ("medium", "low"): 4,
          ("low", "high"): 3, ("low", "medium"): 4, ("low", "low"): 5}
RESOLVE = {1: ("calendar", 4), 2: ("calendar", 8), 3: ("business", 27), 4: ("business", 45)}
OPEN, CLOSE = 8, 17          # business day 08:00 to 17:00, Monday to Friday

def add_business_hours(t, hours):
    remaining = timedelta(hours=hours)
    while remaining > timedelta(0):
        if t.weekday() >= 5 or t.hour >= CLOSE:          # weekend or after hours
            t = (t + timedelta(days=1)).replace(hour=OPEN, minute=0)
            continue
        if t.hour < OPEN:
            t = t.replace(hour=OPEN, minute=0)
        end_of_day = t.replace(hour=CLOSE, minute=0)
        step = min(remaining, end_of_day - t)
        t += step
        remaining -= step
    return t

def due(logged, impact, urgency):
    p = MATRIX[(impact, urgency)]
    if p not in RESOLVE:
        return p, "agreed with user"
    clock, h = RESOLVE[p]
    d = logged + timedelta(hours=h) if clock == "calendar" else add_business_hours(logged, h)
    return p, d.strftime("%a %Y-%m-%d %H:%M")

cases = [("Payroll down for all staff", "high", "high", datetime(2026, 10, 23, 16, 30)),
         ("Team share slow, workaround", "medium", "medium", datetime(2026, 10, 23, 16, 30)),
         ("One user cannot print", "low", "medium", datetime(2026, 10, 23, 16, 30)),
         ("Wish list: new report", "low", "low", datetime(2026, 10, 23, 16, 30))]
for name, imp, urg, t in cases:
    p, d = due(t, imp, urg)
print(f"P{p} {name:30} due {d}")P1 Payroll down for all staff due Fri 2026-10-23 20:30 P3 Team share slow, workaround due Wed 2026-10-28 16:30 P4 One user cannot print due Fri 2026-10-30 16:30 P5 Wish list: new report due agreed with user
All four incidents were logged at 16:30 on a Friday. The P1 is due at 20:30 the same evening because it runs on calendar time. The P3, with 27 business hours (three nine-hour days), carries over the weekend and is due at 16:30 on Wednesday. The P4 is due the following Friday. The calculation is mechanical once the rules are defined, which is why tools do it; the hard part is agreeing sensible rules.
Avoiding priority inflation
Priority inflation happens when users and agents inflate impact and urgency to jump the queue. If everything is priority 1, nothing is, and genuinely critical incidents compete with trivial ones. Clear definitions, published examples, a rule that only the service desk sets priority, and regular reviews of priority distributions all help. A healthy distribution usually has few P1s, more P2s and most incidents at P3 and P4.
Worked problem
Checking the priority distribution
In one month a provider records 1,200 incidents: 180 at P1, 260 at P2, 420 at P3 and 340 at P4. Calculate the share at each level and comment.
Show solution
- P1: 180 ÷ 1,200 = 15 %.
- P2: 260 ÷ 1,200 ≈ 21.7 %.
- P3: 420 ÷ 1,200 = 35 %; P4: 340 ÷ 1,200 ≈ 28.3 %.
- Fifteen per cent at P1 is very high. Unless the provider suffered a run of genuine outages, P1 is probably being used for urgent individual issues; reviewing a sample of P1 records against the definitions would confirm this.
Answer: The P1 share of 15 % suggests priority inflation; most organizations see P1 as a small fraction of incidents.
Very important persons (VIPs) pose a related challenge. Many organizations give senior executives faster support, which can be reasonable if their work has high business impact. The risk is that VIP status becomes a substitute for assessing impact, so that a director's minor issue displaces a site-wide outage. A transparent rule, such as raising urgency by one level for designated roles while leaving impact assessment unchanged, keeps the system fair and explainable.
Matching to known errors and initial diagnosis
Before escalating, the service desk tries to match the incident to known information. Is there an ongoing major incident affecting this service? Is there a known error with a documented workaround? Is there a knowledge article for this symptom? Is there a recent change that might be the cause? Matching quickly is one of the main ways to resolve incidents at first contact. It depends on problem management keeping known errors current (lesson 5), knowledge management keeping articles accurate (lesson 10) and change enablement making recent changes visible (lessons 7 and 8).
If matching fails, the agent performs initial diagnosis using scripts, remote tools and their own experience. Scripts guide the agent through checks in a logical order and capture answers in the record. Remote access tools let the agent see the user's screen or run diagnostics. If the incident cannot be resolved within a reasonable time or needs specialist skills or access, it is escalated, as lesson 4 describes.
Communicating with users
Communication is part of incident management, not an afterthought. Users want to know that their incident has been received, what priority it has, what is happening and when to expect the next update. Silence breeds frustration and duplicate contacts. Simple practices help: an acknowledgement with the reference number and target, updates at agreed intervals for higher priorities, and a clear message on resolution asking the user to confirm. For widespread incidents, status pages and banners in the portal reduce the flood of individual contacts.
Common mistakes
MistakeTreating only total outages as incidents.
InsteadReductions in quality, such as slowness or intermittent errors, are incidents too.
MistakeFixing small issues without logging them.
InsteadLog every incident so it can be measured and analysed for patterns.
MistakeBuilding a category list with hundreds of options.
InsteadKeep categories short, meaningful and reviewed, with a separate closure category.
MistakeLetting users set their own priority.
InsteadDerive priority from defined impact and urgency, set by the service desk.
MistakeGiving VIPs top priority regardless of impact.
InsteadUse transparent rules, such as raising urgency by one level, while assessing impact honestly.
Summary and key terms
- Incident management minimizes the negative impact of incidents by restoring normal service as quickly as possible.
- An incident is an unplanned interruption to a service or a reduction in its quality.
- Workflows usually cover detection, logging, categorization, prioritization, diagnosis, escalation, resolution and closure.
- Every incident should be logged with enough detail for others to continue the work and analyse trends.
- Categories should be short, meaningful and checked against actual use.
- Priority combines impact and urgency through a matrix with concrete definitions and agreed targets.
- Matching to known errors, knowledge and recent changes resolves many incidents early.
- Incident
- An unplanned interruption to a service or a reduction in the quality of a service.
- Incident management
- The practice of minimizing the negative impact of incidents by restoring normal service quickly.
- Impact
- A measure of the effect of an incident on the business.
- Urgency
- A measure of how quickly the business needs an incident resolved.
- Priority
- The relative importance of an incident, usually derived from impact and urgency.
- Categorization
- Grouping incidents by type for routing and analysis.
- Response target
- The time within which work on an incident must start.
- Resolution target
- The time within which service must be restored.
- Priority inflation
- Overstating impact or urgency so that too many incidents receive high priority.
- Diagnostic script
- A structured set of questions and checks that guides initial diagnosis.
Practice problems
Work each problem on paper first, then reveal the answer to check.
Is a web page that loads in 40 seconds instead of 2 an incident? Why?
Show answer
Yes; it is a reduction in the quality of the service.
Give two reasons to log incidents that were fixed in a minute.
Show answer
To measure impact and workload, and to give problem management data for spotting patterns.
Using the lesson's matrix, what priority is medium impact and high urgency?
Show answer
Priority 2.
What is the difference between impact and urgency?
Show answer
Impact is the effect on the business; urgency is how quickly resolution is needed.
A P3 incident has a 27-business-hour target and is logged on Monday at 08:00. When is it due, with 08:00–17:00 business days?
Show answer
Wednesday at 17:00 (three nine-hour days).
In a month of 800 incidents, 40 are P1. What share is P1, and does it look healthy?
Show answer
5 %; that is within the range many organizations consider reasonable, though it depends on the services.
Why keep a separate closure category?
Show answer
Because the true nature of an incident is often clearer at resolution than at logging.
Name three things the service desk checks before escalating.
Show answer
Ongoing major incidents, known errors and workarounds, knowledge articles and recent changes (any three).
How can VIP support be handled fairly?
Show answer
With a transparent rule, such as raising urgency by one level for designated roles while assessing impact honestly.
Why do status pages help during widespread incidents?
Show answer
They inform many users at once and reduce duplicate contacts.
Lesson quiz · 5 questions
Score 60% or more to complete this lesson.
Create a free account to save your progress, take quizzes and earn a certificate.