
ITIL-140 · Lesson 5 of 12 · 35 min
Problem management
Incident management restores service; problem management asks why the incident happened and how to stop it happening again. In plain words, the purpose of problem management is to reduce the likelihood and impact of incidents by identifying their actual and potential causes, and by managing workarounds and known errors. An organization that only fights incidents stays busy forever. An organization that also manages problems gradually removes the causes of recurring pain and frees capacity for more valuable work.
Key terms
ITIL uses three related terms that are often confused. A problem is a cause, or potential cause, of one or more incidents. A known error is a problem that has been analysed but not yet resolved; its cause is understood, or at least a workaround is documented. A workaround is a solution that reduces or eliminates the impact of an incident or problem for which a full resolution is not yet available. Workarounds can be applied by users, the service desk or technical teams, and good ones are recorded in the known error database so everyone can find them.
The distinction between incidents and problems is essential. An incident is the event users experience: the service is down. A problem is the underlying cause: a memory leak, a misconfigured load balancer, a supplier defect. One problem can cause many incidents, and one incident may reveal several problems. Incident records describe impact and restoration; problem records describe causes and their removal.
| Term | Plain meaning | Example |
|---|---|---|
| Incident | Unplanned interruption or reduction in quality | Users cannot log in to the expenses system |
| Problem | Cause or potential cause of incidents | Authentication tokens are not renewed after a certificate change |
| Known error | Problem analysed but not yet resolved | Cause identified; permanent fix scheduled for next release |
| Workaround | Way to reduce impact while the fix is pending | Clear the browser cache and sign in again |
Three phases of problem management
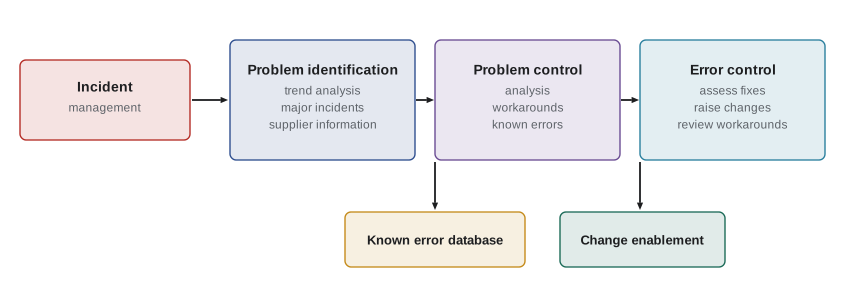
ITIL 4 describes problem management in three phases. Problem identification finds problems. Problem control analyses them and documents workarounds and known errors. Error control manages known errors through to resolution, including deciding whether a permanent fix is worth its cost. The phases overlap, and a problem may move back and forth between them as understanding grows.
Problem identification
Problems are identified in two main ways. Reactive identification follows incidents: a major incident almost always triggers a problem record, and trend analysis of incident data reveals recurring issues that individually seemed minor. Proactive identification looks for problems before they cause incidents: reviewing information from suppliers and developers about known defects, analysing monitoring data for early signs of trouble, examining near misses, and learning from incidents at other organizations that use similar technology.
Trend analysis is one of the most valuable and most neglected activities. It depends on good incident data, which is why lesson 3 stressed logging and categorization. A simple and powerful technique is Pareto analysis, which sorts incident categories from most to least frequent and shows how much of the total the top few account for. Often a small number of categories accounts for a large share of incidents, and attacking those gives the biggest return.
# Pareto analysis of a quarter's incidents by closure category (synthetic data)
counts = {
    "password and lockout": 640, "VPN connection drops": 410, "printer queue stuck": 285,
    "email sync on mobile": 190, "report timeouts": 150, "laptop docking": 95,
    "shared drive permissions": 80, "browser plugin errors": 60, "other": 90,
}
total = sum(counts.values())
running = 0
print(f"{'category':26}{'count':>7}{'share':>8}{'cumulative':>12}")
for cat, n in sorted(counts.items(), key=lambda kv: kv[1], reverse=True):
    running += n
    flag = "  <- top group" if running - n < 0.8 * total else ""
    print(f"{cat:26}{n:>7}{n/total:>8.1%}{running/total:>12.1%}{flag}")
print(f"total incidents: {total}")category count share cumulative password and lockout 640 32.0% 32.0% <- top group VPN connection drops 410 20.5% 52.5% <- top group printer queue stuck 285 14.2% 66.8% <- top group email sync on mobile 190 9.5% 76.2% <- top group report timeouts 150 7.5% 83.8% <- top group laptop docking 95 4.8% 88.5% other 90 4.5% 93.0% shared drive permissions 80 4.0% 97.0% browser plugin errors 60 3.0% 100.0% total incidents: 2000
In this synthetic quarter, the first four categories account for roughly three-quarters of all incidents, and the first five for over 80 %. A problem manager would open problems for the top categories first. Note the caution, though: frequency is not the only measure. One rare category may have very high impact per incident. Weighting each category by its business impact or by the total hours lost often changes the ranking.
Worked problem
Weighting by impact
Printer queue incidents occur 285 times a quarter and cost 10 minutes of user time each. Report timeouts occur 150 times a quarter but each one delays a finance analyst by 90 minutes. Which category causes more lost time?
Show solution
- Printer queue: 285 × 10 = 2,850 minutes ≈ 47.5 hours.
- Report timeouts: 150 × 90 = 13,500 minutes = 225 hours.
- Report timeouts cause nearly five times as much lost time despite being less frequent.
Answer: Report timeouts cause about 225 hours of lost time against about 47.5 hours for printer queues, so they deserve priority.
Problem control
Problem control analyses problems to find their causes and, where possible, documents workarounds. Problems are prioritized in the same spirit as incidents, based on the risk they pose: how many incidents they cause or could cause, how severe those incidents are, and how likely recurrence is. Not every problem deserves deep analysis. A problem that caused one minor incident three years ago and never recurred may be recorded and left alone.
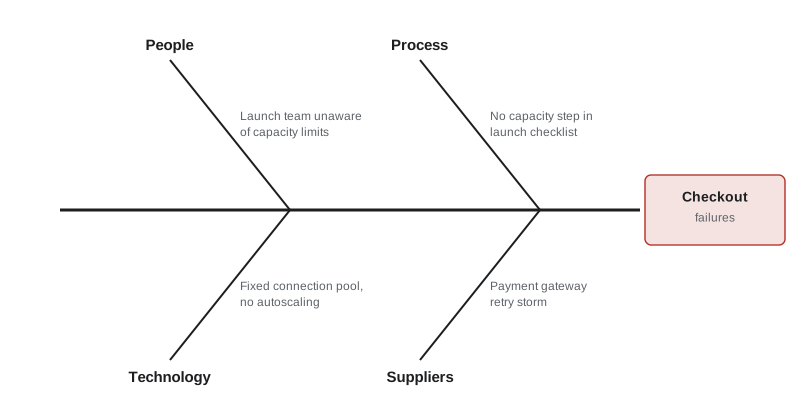
Analysis uses structured techniques. ITIL does not mandate any, but several are widely used. The five whys asks why repeatedly until a cause is reached that, if removed, would prevent recurrence. Ishikawa (fishbone) diagrams group possible causes under headings such as people, process, technology and suppliers. Kepner–Tregoe problem analysis defines the problem precisely by contrasting what is affected with what is not, then tests candidate causes against those distinctions. Fault tree analysis works backward from an undesired event through logical combinations of causes. Timeline analysis reconstructs what changed and when.
Worked problem
Five whys
An online store's checkout failed for 40 minutes on Saturday evening. Apply the five whys.
Show solution
- Why did checkout fail? The payment service returned errors.
- Why did the payment service return errors? It could not connect to its database.
- Why could it not connect? The database had reached its maximum number of connections.
- Why were connections exhausted? A new promotion tripled traffic and the connection pool was sized for normal load.
- Why was the pool not resized? Capacity planning was not part of the promotion launch checklist.
Answer: The technical trigger was connection exhaustion, but the cause worth fixing is the missing capacity review in the promotion process. Fixes include resizing the pool, adding autoscaling and adding capacity checks to the launch checklist.
The five whys is quick but has limits: it tends to produce a single chain when real failures usually have several contributing factors, and the answer depends on who asks the questions. Combining it with a fishbone diagram or a timeline helps uncover parallel causes.
Worked problem
Kepner–Tregoe is and is not
Some users report that a document management system logs them out every few minutes. Investigation shows the problem affects users in the Calgary office but not Edmonton, started on Tuesday but not before, and occurs on laptops but not desktops. What do these contrasts suggest?
Show solution
- List what is different about the affected group: Calgary, since Tuesday, laptops.
- Ask what changed that matches all three: a new wireless access point configuration was deployed in Calgary on Tuesday; desktops use wired connections.
- Candidate cause: the wireless change causes frequent address renewal, which the application treats as a new session.
- Test: connect an affected laptop by cable in Calgary; if logouts stop, the cause is confirmed.
Answer: The is and is-not contrasts point to the Tuesday wireless change in Calgary, which can be tested and, if confirmed, corrected through change enablement.
Workarounds and the known error database
When a workaround is found, it should be documented, tested and published so the service desk and users can apply it without rediscovering it. Workarounds are stored with the known error, often in a known error database or within the knowledge base. A good workaround record describes the symptoms that identify the problem, the steps to apply the workaround, any side effects and when it was last verified. The service desk links new incidents to the known error, which both speeds resolution and counts how often the problem recurs.
Workarounds are valuable, but they have costs. Each application takes time, and a workaround that users find annoying hurts their experience. Some workarounds become permanent by default because nobody revisits them. Error control should periodically review workarounds and ask whether the accumulated cost now justifies a permanent fix.
Worked problem
The value of a workaround
A known error causes about 60 incidents a month. Without a documented workaround, each takes 45 minutes of specialist time to resolve. With the workaround published in the knowledge base, the service desk resolves each in 8 minutes. Specialist time costs $90 an hour and service desk time $45 an hour. What is the monthly saving?
Show solution
- Without the workaround: 60 × 45 min = 2,700 min = 45 hours × $90 = $4,050.
- With the workaround: 60 × 8 min = 480 min = 8 hours × $45 = $360.
- Saving: $4,050 − $360 = $3,690 a month, plus faster restoration for users.
Answer: Publishing the workaround saves about $3,690 a month in support time.
Error control
Error control manages known errors. It assesses whether and how to remove the cause permanently, raises change requests for fixes, tracks those changes, and reviews workarounds. The decision to fix is economic and risk-based. A permanent fix has a cost: development effort, testing, a change with its own risk, perhaps a supplier upgrade. Not fixing also has a cost: continuing incidents, workaround effort and user frustration. Error control compares the two and recommends an action, which the service owner or a governance body decides.
Worked problem
Fix or live with it?
A known error costs $3,690 a month in workaround effort plus an estimated $2,000 a month in lost user productivity. A permanent fix requires a vendor upgrade costing $40,000, including testing and deployment. How long is the payback? What else should be considered?
Show solution
- Monthly cost of the known error: $3,690 + $2,000 = $5,690.
- Payback: $40,000 ÷ $5,690 ≈ 7.0 months.
- Other factors: the risk of the upgrade itself, whether the upgrade fixes other problems, whether the product is being retired soon, and whether the incidents carry compliance or reputational risk.
Answer: Payback is about seven months, which usually justifies the fix unless the product is due for replacement or the upgrade is unusually risky.
Known errors in third-party products are managed through suppliers. Problem management raises the issue with the vendor, tracks the vendor's response, and maintains the workaround until a fix is released. Contracts and supplier management (covered in ITIL-141) determine how much leverage the organization has.
People, culture and ownership
Problem management fails most often for organizational reasons. Teams are busy with incidents and projects, so problems are recorded but never investigated. Nobody owns cross-team problems. Analysis is treated as a search for blame, so people are reluctant to share information. Fixes compete with feature work and lose. Successful organizations give problem management protected time, assign clear problem owners, review open problems regularly with service owners, track the age and impact of the problem backlog, and celebrate removed causes as visibly as heroic incident fixes.
Some organizations have dedicated problem managers who coordinate analysis and track the backlog; others distribute the work across technical teams with a coordinator. Both can work. The essential ingredients are that someone looks at the trends, someone decides which problems to tackle, and the people who can fix the causes are given time to do so.
| Metric | What it shows | Caution |
|---|---|---|
| Repeat incidents linked to known problems | Whether causes are being removed | Requires good linking of incidents to problems |
| Problems with a published workaround | How well problem control supports the service desk | A workaround is not a fix |
| Average age of open problems | Whether the backlog is being worked | Old low-risk problems may be fine to leave |
| Incidents avoided (estimated) | Value delivered by fixes | Estimates can be inflated |
| Major incidents with completed problem analysis | Whether serious events lead to learning | Quality of analysis matters more than completion |
Connections to other practices
Problem management draws on incident data from incident management and the service desk, monitoring data from monitoring and event management, configuration data from service configuration management and change history from change enablement. It sends workarounds to knowledge management and the service desk, and permanent fixes to change enablement, which assesses and authorizes them like any other change. It contributes to risk management, because known errors are risks, and to continual improvement, because removing causes is improvement. In DevOps teams, problem management often happens inside the same team that builds and runs the service, which shortens the loop from cause to fix.
Common mistakes
MistakeTreating incidents and problems as the same thing.
InsteadAn incident is the interruption; a problem is its cause. One problem can cause many incidents.
MistakeHolding incidents open until the root cause is fixed.
InsteadResolve the incident when service is restored and track the cause in a problem record.
MistakeRanking problems only by incident count.
InsteadWeight by business impact, lost time and risk as well as frequency.
MistakeLetting workarounds become permanent by default.
InsteadReview workarounds regularly and compare their accumulated cost with a permanent fix.
MistakeUsing problem analysis to assign blame.
InsteadUse blameless, structured analysis focused on system causes.
Summary and key terms
- Problem management reduces the likelihood and impact of incidents by identifying causes and managing workarounds and known errors.
- A problem is a cause of incidents; a known error is an analysed but unresolved problem; a workaround reduces impact meanwhile.
- The three phases are problem identification, problem control and error control.
- Trend and Pareto analysis reveal recurring problems; weighting by impact refines priorities.
- Techniques such as five whys, fishbone diagrams and Kepner–Tregoe structure the search for causes.
- Error control weighs the cost of a permanent fix against the cost of living with the known error.
- Protected time, clear ownership and a blameless culture make problem management work.
- Problem
- A cause, or potential cause, of one or more incidents.
- Known error
- A problem that has been analysed but has not been resolved.
- Workaround
- A solution that reduces or eliminates the impact of an incident or problem without a full resolution.
- Problem identification
- Finding problems through trend analysis, major incidents and proactive review.
- Problem control
- Analysing problems and documenting workarounds and known errors.
- Error control
- Managing known errors, including assessing and raising permanent fixes.
- Known error database
- A store of known errors and their workarounds, used by support staff.
- Pareto analysis
- Ranking causes by frequency or impact to find the few that account for most of the effect.
- Five whys
- Asking why repeatedly to move from symptoms toward a removable cause.
- Kepner–Tregoe problem analysis
- Defining a problem by contrasting what is and is not affected, then testing candidate causes.
Practice problems
Work each problem on paper first, then reveal the answer to check.
Distinguish an incident from a problem with an example.
Show answer
Incident: users cannot print. Problem: a print server driver defect that causes the failures.
What is a known error?
Show answer
A problem that has been analysed, with a cause or workaround identified, but not yet resolved.
Name the three phases of problem management.
Show answer
Problem identification, problem control and error control.
Give two sources of proactive problem identification.
Show answer
Supplier and developer information about defects, early signs in monitoring data, near misses or industry incidents (any two).
Category A has 300 incidents of 5 minutes each; category B has 40 incidents of 2 hours each. Which loses more time?
Show answer
A: 1,500 minutes (25 hours). B: 4,800 minutes (80 hours). B loses more.
What is one limitation of the five whys?
Show answer
It tends to produce a single causal chain and depends on who asks the questions.
A known error costs $4,000 a month and a fix costs $30,000. What is the payback?
Show answer
7.5 months.
Why should workarounds be reviewed regularly?
Show answer
Their accumulated cost may come to justify a permanent fix, and they may stop working.
Which practice assesses and authorizes permanent fixes?
Show answer
Change enablement.
Give two organizational reasons problem management fails.
Show answer
No protected time, no clear owners, a blame culture or fixes losing to feature work (any two).
Lesson quiz · 5 questions
Score 60% or more to complete this lesson.
Create a free account to save your progress, take quizzes and earn a certificate.