
PRIN-131 · Lesson 8 of 12 · 23 min
The progress practice II: controls, baselines and reports
Tolerances tell each level of management how much freedom it has. Controls tell it how it will find out whether it is staying within that freedom. This lesson covers the two kinds of progress control, event-driven and time-driven, the baselines against which progress is measured, the logs and registers that feed progress reporting, and the reports themselves: checkpoint, highlight, end stage, end project, exception and lessons reports. It ends with forecasting techniques, including earned value at stage level.
Event-driven and time-driven controls
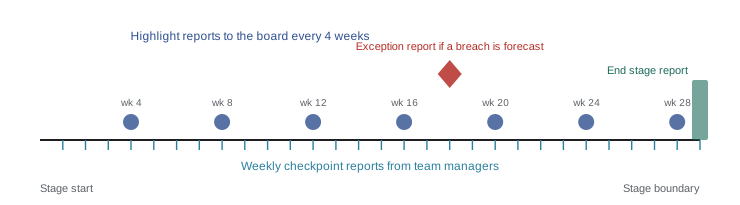
PRINCE2 distinguishes two kinds of control. Event-driven controls take place when a specific event occurs: the end of a stage, the completion of the project initiation documentation, the creation of an exception report, or the end of the project. Time-driven controls take place at predefined periodic intervals: weekly checkpoint reports from team managers to the project manager, and monthly or fortnightly highlight reports from the project manager to the board. A good control system uses both. Time-driven reports give a steady rhythm of information; event-driven controls make sure decisions happen when they are needed, not just when a reporting date comes round.
| Control | Type | Trigger | Main decision or purpose |
|---|---|---|---|
| Authorization of initiation and of the project | Event-driven | Completion of the project brief; completion of the project initiation documentation | Whether to invest in initiation, then in the project |
| Stage authorization at a stage boundary | Event-driven | End of a management stage | Whether to continue, and with what plan and tolerances |
| Exception report and exception assessment | Event-driven | Forecast breach of stage or project tolerance | How to respond to the exception |
| Project closure | Event-driven | Completion of the final stage, or premature closure | Confirm acceptance, handover and follow-on actions |
| Checkpoint report | Time-driven | Frequency set in the work package | Keep the project manager informed of work package progress |
| Highlight report | Time-driven | Frequency set by the board | Keep the board informed of stage progress |
Baselines for progress control
Progress is measured against baselines. The main ones are the project plan, the current stage plan and any work package descriptions, which give planned products, dates, costs and tolerances; the business case, which gives the expected costs, benefits and risks against which viability is judged; and product descriptions, which give quality criteria. Lesson 6 explained why these must be changed only through change control: if baselines move without control, reports always look good and tell the board nothing.
Progress is best measured in terms of products rather than activities. Reporting that the billing interface work is 60 % done invites the question: 60 % of what? Reporting that three of five interface products have passed their quality checks is verifiable. This follows directly from the principle of focus on products and is one reason PRINCE2 links the product register, quality register and plans so closely.
Logs and registers that feed progress
The project log in PRINCE2 7 brings together the records that progress reports draw on. The daily log captures the project manager's informal notes. The issue register and risk register hold formally managed issues and risks. The quality register shows planned and completed quality activities. The product register shows each product's status. The lessons log holds lessons from this and earlier projects, which are reviewed at the start and recorded throughout. A highlight report that is assembled from these records, rather than written from memory, is both quicker to produce and more trustworthy.
| Record in the project log | What it contributes to progress reporting |
|---|---|
| Daily log | Actions, events and informal problems that may need reporting |
| Issue register | Open issues, decisions taken, changes approved and change budget used |
| Risk register | Key risks, changes in exposure, use of risk budget |
| Quality register | Quality activities done and overdue; first-time pass rate |
| Product register | Products approved, in progress and late |
| Lessons log | Lessons identified that may help this or future projects |
Checkpoint and highlight reports
A checkpoint report goes from a team manager to the project manager, at the frequency set in the work package. In plain terms, it covers the period, products completed and in progress, quality activities carried out, follow-ups from the previous report, work planned for the next period, the status of work package tolerances, and any issues and risks. A highlight report goes from the project manager to the board, at the frequency the board set. It covers the period, the status of the stage against plan and tolerances, products completed and planned, issues and risks, approved changes and change budget used, lessons, and any requests for board guidance or decisions. A highlight report is not a request for approval; it is a way of confirming to the board that the stage is within tolerance, or warning it that it is getting close.
Many boards prefer highlight reports that show status at a glance, often using red, amber and green ratings for each performance target. The ratings should be based on tolerance, not on mood: green when the forecast is comfortably within tolerance, amber when a large share of the tolerance has been used, red when a breach is forecast. The code below builds the status section of a highlight report from forecasts and tolerances using that rule, with amber starting at 70 % of tolerance used, and adds lines from the registers.
period = "weeks 21-24"
status = {  # target: (share of tolerance used by forecast, comment)
    "time": (0.75, "billing interface forecast 1.5 weeks late; recovery plan agreed"),
    "cost": (0.81, "contractor added to interface work from the risk budget"),
    "scope": (0.40, "2,800 of 3,000 connections forecast live"),
    "quality": (0.60, "read rate 97.4 % over 30 days; target 98 %"),
    "risk": (0.96, "interface risk EV 96k against 100k limit"),
    "sustainability": (0.20, "van mileage on plan"),
}
def rag(used):
    return "RED" if used > 1 else "AMBER" if used >= 0.7 else "GREEN"
print(f"HIGHLIGHT REPORT  pilot stage  {period}")
for t, (used, note) in status.items():
    print(f"  {t:15} {rag(used):5} {used:4.0%} of tolerance used - {note}")
registers = {"products approved this period": 2, "open issues": 5, "changes approved": 2,
             "change budget left (k)": 23, "risk budget left (k)": 80}
for k, v in registers.items():
    print(f"  {k}: {v}")
ambers = [t for t, (u, _) in status.items() if rag(u) == "AMBER"]
print("board guidance sought on:", ", ".join(ambers))HIGHLIGHT REPORT pilot stage weeks 21-24 time AMBER 75% of tolerance used - billing interface forecast 1.5 weeks late; recovery plan agreed cost AMBER 81% of tolerance used - contractor added to interface work from the risk budget scope GREEN 40% of tolerance used - 2,800 of 3,000 connections forecast live quality GREEN 60% of tolerance used - read rate 97.4 % over 30 days; target 98 % risk AMBER 96% of tolerance used - interface risk EV 96k against 100k limit sustainability GREEN 20% of tolerance used - van mileage on plan products approved this period: 2 open issues: 5 changes approved: 2 change budget left (k): 23 risk budget left (k): 80 board guidance sought on: time, cost, risk
Three targets are amber: time, cost and risk, each with more than 70 % of its tolerance used. None is red, so no exception report is needed, but the project manager asks the board for guidance on all three. This is exactly the kind of early, factual warning that highlight reports exist to provide. A report showing everything green while three tolerances are nearly used up would be technically accurate in a narrow sense and misleading in every useful one.
End stage, end project and lessons reports
At the end of each stage, the project manager prepares an end stage report for the board. It reviews the stage's performance against its plan and tolerances, confirms which products have been approved, reviews the business case, risks and issues, records lessons and gives the project manager's view of whether the project should continue. It accompanies the next stage plan, the updated project plan and the updated business case, which together give the board what it needs to authorize the next stage. At the end of the project, the end project report reviews the whole project against its original and current baselines, confirms acceptance and handover, and summarizes follow-on actions and how benefits will be reviewed.
| Report | From and to | When | Main purpose |
|---|---|---|---|
| Checkpoint report | Team manager to project manager | Frequency in the work package | Work package progress, quality checks, tolerances, issues and risks |
| Highlight report | Project manager to board | Frequency set by the board | Stage status against plan and tolerances; requests for guidance |
| Exception report | Project manager to board | When stage or project tolerance is forecast to be exceeded | Describe the exception, options and recommendation (lesson 9) |
| Issue report | Project manager to the decision-maker | When an issue needs a formal decision | Describe the issue, impact and recommendation |
| End stage report | Project manager to board | End of each stage | Review of the stage and a view on continuing |
| Lessons report | Project manager to board, and on to the organization | When useful, and at least at project end | Share lessons so others can benefit |
| End project report | Project manager to board | Closing the project | Review of the project; acceptance, handover and follow-on actions |
Forecasting with earned value
Forecasts can be made by asking team managers for estimates to complete, by re-running the schedule with actual dates, or by using earned value, which PMP-130 covers in depth. Earned value compares the planned value of work scheduled, the earned value of work actually completed and the actual cost of that work. Two indices summarize performance: the cost performance index (CPI), earned value divided by actual cost, and the schedule performance index (SPI), earned value divided by planned value. A simple forecast of cost at completion divides the budget at completion by the CPI, which assumes that current cost efficiency continues.
bac = 1450                      # stage budget at completion, thousand
weeks_total, week_now = 29, 24
pv = 1180                       # planned value of work scheduled to date
ev = 1110                       # value of products actually completed (earned)
ac = 1155                       # actual cost to date
cpi, spi = ev / ac, ev / pv
eac_cpi = bac / cpi
eac_remaining_on_plan = ac + (bac - ev)
print(f"CPI {cpi:.3f}  SPI {spi:.3f}")
print(f"EAC if current efficiency continues: {eac_cpi:.0f}")
print(f"EAC if remaining work goes to plan:  {eac_remaining_on_plan:.0f}")
print(f"upper cost tolerance: {bac * 1.05:.0f}")
print(f"rough time forecast: {weeks_total / spi:.1f} weeks")CPI 0.961 SPI 0.941 EAC if current efficiency continues: 1509 EAC if remaining work goes to plan: 1495 upper cost tolerance: 1522 rough time forecast: 30.8 weeks
At week 24, the stage has earned 1,110 thousand of value against 1,180 planned, at a cost of 1,155. The CPI of about 0.96 and SPI of about 0.94 show that the stage is slightly over cost and behind schedule. If current efficiency continues, the stage will cost about 1,509 thousand, just inside the 1,522 thousand upper tolerance; if the remaining work goes exactly to plan, it will cost about 1,495. The rough time forecast of about 30.8 weeks is inside the 31-week limit. Both forecasts agree with the amber ratings in the highlight report: the stage is likely to finish within tolerance, but with little margin. Earned value works best when progress is measured by products completed and approved, which is another reason for the product focus described above.
Common mistakes
MistakeRelying only on time-driven reports.
InsteadUse event-driven controls too, so decisions happen when events require them.
MistakeMeasuring progress as percentage of effort spent.
InsteadMeasure progress by products completed and approved against plan.
MistakeRating everything green until a tolerance is actually breached.
InsteadBase ratings on tolerance used by the forecast, with amber well before a breach.
MistakeWriting highlight reports from memory.
InsteadAssemble them from the registers and logs in the project log.
MistakeTreating the highlight report as a request for approval.
InsteadIt informs the board and seeks guidance; approvals happen at event-driven controls.
Summary and key terms
- Event-driven controls occur when something happens; time-driven controls occur at set intervals.
- Progress is measured against baselined plans, the business case and product descriptions.
- Measuring progress by products is more reliable than measuring effort.
- The project log's registers and logs feed progress reports.
- Checkpoint reports go from team managers to the project manager; highlight reports go from the project manager to the board.
- End stage, end project and lessons reports support event-driven decisions and learning.
- Earned value indices and estimates at completion support forecasts against tolerance.
- Event-driven control
- A control that takes place when a specific event occurs.
- Time-driven control
- A control that takes place at predefined periodic intervals.
- Checkpoint report
- A progress report from a team manager to the project manager.
- Highlight report
- A periodic report from the project manager to the board on stage status.
- End stage report
- A report reviewing a completed stage and giving a view on continuing.
- End project report
- A report reviewing the project at closure.
- Lessons report
- A report that documents lessons for this and future projects.
- Earned value
- The planned value of the work actually completed.
- Cost performance index
- Earned value divided by actual cost.
- Schedule performance index
- Earned value divided by planned value.
Practice problems
Work each problem on paper first, then reveal the answer to check.
Give one event-driven and one time-driven control.
Show answer
For example, an end stage report (event-driven) and a highlight report (time-driven).
Who sends checkpoint reports, and to whom?
Show answer
Team managers to the project manager.
Who sets the frequency of highlight reports?
Show answer
The project board.
Why measure progress by products?
Show answer
Completed and approved products can be verified; percentages of effort cannot.
Which records in the project log feed a highlight report?
Show answer
Daily log, issue register, risk register, quality register, product register and lessons log.
EV 900, AC 1,000. What is the CPI?
Show answer
0.9.
BAC 2,000 and CPI 0.8. What is EAC by the simple formula?
Show answer
2,500.
What does the end stage report accompany at a stage boundary?
Show answer
The next stage plan, updated project plan and updated business case.
When should a project status be rated amber?
Show answer
When a large share of a tolerance has been used by the forecast, as defined by the board.
What is the main purpose of the end project report?
Show answer
To review the project, confirm acceptance and handover, and set out follow-on actions.
Lesson quiz · 5 questions
Score 60% or more to complete this lesson.
Create a free account to save your progress, take quizzes and earn a certificate.