
SLS-257 · Lesson 11 of 12 · 23 min
Measuring retail marketing
▶ Video coming soon A video version of this lesson is on the way.
Early on Friday, November 13, 2026, before the owners' meeting at two o'clock, Aiden and Tessa spread eight weeks of results across the back office table: the Labour Day promotion, Design Night, the flyer, two emails, the rug follow-up, the social advertisement and the realtor cards. Each had a number attached, and each number looked good. "If we add these up," Aiden said, "marketing produced more sales this fall than the store actually made." Tessa laughed. "That's the first thing to learn about measuring marketing. Every channel takes credit for the same customers."
This lesson pulls together the measurement ideas used throughout the course. It explains the difference between sales that follow marketing and sales caused by it, the practical tests a store can run to tell them apart, the measures that matter, how to report results honestly and how to plan the measurement of the loyalty program before it launches. SLS-254 covered website analytics, advertising measures and attribution models for online selling; here the focus is a whole store's marketing, online and off.
Following versus causing
A customer who received the October email, saw a social advertisement, walked past the holiday window and then bought a sofa would be counted by the email report, the advertising report and the store's own sense that the window works. Each report is true in its own terms: the customer did receive the email and did click the advertisement. None of them shows that the marketing caused the purchase. Many of these customers would have bought anyway, because they were already planning to, because the store is close or because they are loyal regardless.
The sales that would not have happened without the marketing are called incremental sales. They are the only ones that justify the cost. Measuring them requires a comparison: what happened to people who received the marketing compared with similar people who did not. Without that comparison, a report can only show what followed the marketing, and a busy season makes almost everything look successful.
Tests a store can run
Large retailers run sophisticated experiments. A single store can run simple versions of the same tests, as long as it plans them before the campaign starts.
| Method | How it works | Good for | Limits |
|---|---|---|---|
| Holdout group | A random part of the audience does not receive the message; compare results | Email, text, mailings to known customers | Needs enough people; holdout misses the message |
| Area test | Run the campaign in some areas and not others; compare sales | Flyers, radio, local advertising | Areas differ; few areas for one store |
| Before and after, with a baseline | Compare results with the same period last year or a forecast | Events, store-wide changes | Weather, season and competitors also change |
| Unique codes or offers | A code or card tied to one channel | Partnerships, flyers | Undercounts people who forget the code |
| Asking customers | How did you hear about us? | New customers | Memory is unreliable; people name the last thing |
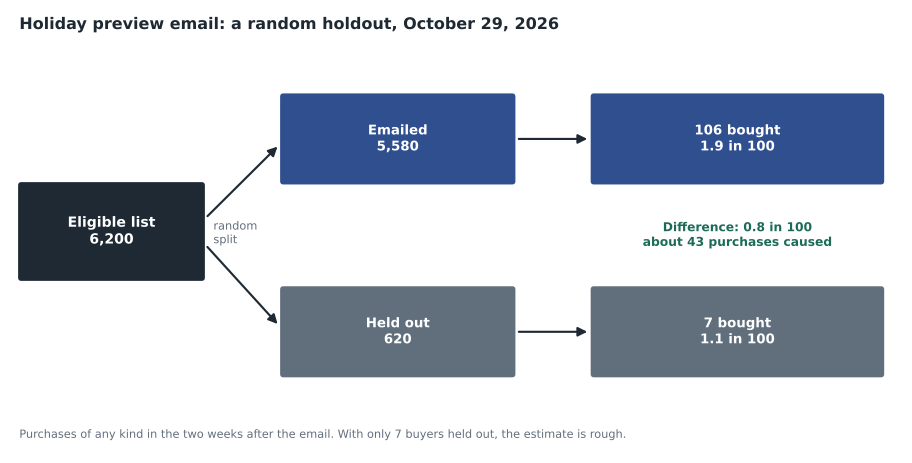
The holdout group is the most reliable method for marketing sent to known customers. The October 15 email in lesson 6 had no holdout, so its 19 linked purchases could not show what it caused. For the next one, the "Holiday preview" email sent on October 29, Tessa randomly set aside 10 in 100 of the 6,200 addresses on the list. They received no email; everyone else did. Because the split was random, the two groups were alike in every way except the email, so any difference in purchases could be credited to it.
Worked problem
What did the Holiday preview email really cause?
Of the 5,580 customers emailed, 106 made a purchase of any kind at the store in the following two weeks, a rate of 1.9 in 100. Of the 620 held out, 7 made a purchase, a rate of 1.1 in 100. The average purchase was 620 dollars and the gross margin rate 0.394. How many purchases did the email cause, and what margin did they produce?
Show solution
- Purchase rates:
- \[106 \div 5{,}580 \approx 0.019 \qquad 7 \div 620 \approx 0.0113\]
- Purchases the emailed group would have made at the holdout rate:
- \[5{,}580 \times 0.0113 \approx 63\]
- Incremental purchases and margin:
- \[106 - 63 = 43 \qquad 43 \times 620 \times 0.394 \approx 10{,}504\]
Answer: The email caused about 43 of the 106 purchases, and about 10,500 dollars of margin, against costs of a few hundred dollars. The full report would have credited the email with all 106. With only 7 buyers in the holdout, though, the estimate is rough: one or two more holdout buyers would change it a lot.
Small numbers and honest uncertainty
A single store's tests are often small, and small numbers swing. In the email test, if 10 holdout customers had bought instead of 7, the holdout rate would have been 1.6 in 100 and the estimated effect would have shrunk by more than half. Tessa's rule was to report results as a range rather than a single figure when groups were small, to repeat tests before drawing firm conclusions, and to look for the same pattern across several campaigns. A result that appears once may be luck; a result that appears every month is probably real.
Small numbers also affect rates. A text campaign with 12 purchases from 1,300 messages and a holdout with 1 purchase from 150 might seem to show a large effect, but one purchase either way would change the conclusion. In such cases the honest report says the test was too small to tell, and plans a bigger one.
Seasonality and baselines
Retail sales rise and fall with the calendar: the spring move season, back to school, the Black Friday weekend, the December holidays and the quiet weeks of January. A promotion run in a busy week looks successful whether it works or not, and one run in a quiet week can look like a failure. Before-and-after comparisons must therefore compare like with like, usually the same weeks last year, adjusted for the store's overall growth.
Worked problem
Was Design Night a success?
Sales in the week of Design Night, October 19 to 25, 2026, were 268,000 dollars. The same week in 2025 had sales of 231,000 dollars, and the store's sales for 2026 to date were running 6 in 100 above 2025. What were the expected sales for the week without the event, and what extra sales might be credited to it?
Show solution
- Expected sales with the store's growth:
- \[231{,}000 \times 1.06 = 244{,}860\]
- Extra sales above the expected level:
- \[268{,}000 - 244{,}860 = 23{,}140\]
Answer: About 23,000 dollars of the week's sales were above what the store's growth would predict. That is less than the 27,440 dollars estimated in lesson 4 from attendees' purchases, partly because some attendees would have bought anyway and partly because the comparison includes all the week's other variation. The two methods give a similar picture, which makes the conclusion that the event paid for itself more believable.
Measures that matter
Reports are full of measures, and not all of them mean much. Tessa sorted them into three groups. Activity measures, such as emails sent, posts published and flyers delivered, show that work was done. Response measures, such as open rates, clicks, likes, RSVPs and code redemptions, show that people noticed. Business measures, such as incremental sales and margin, new customers, repeat rate, average household spending and cost per new customer, show what the marketing achieved. Activity and response measures help manage campaigns; only business measures justify the budget.
Two common measures need care. Return on advertising spend, sales divided by advertising cost, uses total sales, not margin, and usually counts all sales that followed the advertisement. A flyer producing 18,000 dollars of attributed sales for 3,720 dollars of cost has a return on advertising spend of about 4.8, which sounds excellent but says nothing about the margin earned or whether the sales were incremental. Return on investment for marketing compares the incremental margin with the full cost: (incremental margin minus cost) divided by cost. It is harder to measure but far more useful.
Worked problem
Comparing two measures for the flyer
The fall flyer cost 3,720 dollars. Codes and a postcode comparison suggested it was followed by 18,000 dollars of sales, of which about 11,000 dollars appeared to be incremental. The gross margin rate was 0.394. Calculate the return on advertising spend and the return on investment.
Show solution
- Return on advertising spend:
- \[18{,}000 \div 3{,}720 \approx 4.84\]
- Incremental margin:
- \[11{,}000 \times 0.394 = 4{,}334\]
- Return on investment:
- \[(4{,}334 - 3{,}720) \div 3{,}720 \approx 0.165\]
Answer: The flyer's return on advertising spend of nearly 5 looks impressive, but its return on investment was about 0.17, or 17 cents of profit for each dollar spent, before allowing for the uncertainty in the incremental estimate. It earned its place, narrowly. The email, by comparison, returned many times its cost.
A simple marketing dashboard
Tessa proposed a one-page monthly report for the owners, the same every month so that trends would show. It listed a few business measures for the store as a whole, then each channel's cost, its best estimate of incremental margin and how that estimate was made, with a note when the estimate was rough.
| Measure | October 2026 | Target for 2027 |
|---|---|---|
| 24-month repeat rate | 36 in 100 | 40 in 100 by end of 2027 |
| New households | 190 | Hold or grow |
| Cost per new household | About 48 dollars | Under 60 dollars |
| Email incremental margin | About 10,500 dollars (Holiday preview holdout) | Holdout on every main campaign |
| Reviews answered within two business days | 59 in 100 | Every review |
| Home Club members | Not yet launched | 4,000 by end of 2027 |
Planning measurement for the loyalty program
The biggest measurement question ahead was whether Home Club would change customer behaviour. Lesson 1 showed that loyalty programs tend to attract customers who were already loyal, so comparing members with non-members overstates the program's effect. Members spend more partly because the customers who spend more join. Tessa's plan avoided that trap in three ways.
First, the store would record a baseline before launch: the repeat rate, visit frequency and spending of known households over 2025 and 2026. Second, it would compare each member's spending after joining with the same household's spending before joining, and compare that change with the change among similar non-members over the same period. Third, for specific member offers, it would keep random holdouts, so that a bonus points offer could be judged by the extra purchases it caused rather than the purchases made by members who received it. Reviews of the program were set for six and twelve months after launch, with the decision on whether to continue based on incremental margin against the program's full cost.
Reporting to the owners
How results are reported matters as much as the numbers. Tessa's rules for the monthly report were simple. Show the same few measures every month, so trends are visible. For each channel, say how the estimate was made: holdout, comparison of areas, codes or customer answers. Give a range when the numbers are small. Separate what is known from what is assumed. Report failures as plainly as successes, along with what will change. And keep the report to one page, with details available for anyone who asks.
The owners, Tessa knew, would trust the report more if it occasionally said that something had not worked. The flyer's modest return in the example above was one such case; a radio test in 2025 that produced no measurable change was another. Honest reporting is what allows a store to move money from what does not work to what does, and it protects the people who run campaigns from being judged by a single busy or quiet week.
Common mistakes
MistakeAdd up each channel's reported sales to see what marketing produced.
InsteadChannels overlap; measure each channel's incremental effect with a comparison.
MistakeA campaign that ran in a busy week was a success.
InsteadCompare with the same period last year, adjusted for growth, or use a holdout.
MistakeA high return on advertising spend proves a campaign worked.
InsteadIt uses total, not incremental, sales and ignores margin; return on investment is more useful.
MistakeLoyalty members spend more, so the program works.
InsteadCustomers who spend more are more likely to join; compare changes in behaviour against similar non-members.
MistakeOne test with a few buyers settles the question.
InsteadSmall groups swing; report a range and repeat the test.
Summary and key terms
- Marketing reports show sales that followed the marketing; only a comparison shows what it caused.
- Holdout groups are the most reliable test for messages sent to known customers.
- Small samples are uncertain; report ranges and repeat tests.
- Compare with the same period last year, adjusted for growth, to allow for seasonality.
- Activity and response measures help manage campaigns; business measures such as incremental margin justify budgets.
- Return on investment uses incremental margin and full cost; return on advertising spend can mislead.
- Plan measurement before a loyalty launch: baseline, before-and-after against non-members and holdouts for offers.
- Incremental sales
- Sales that would not have happened without the marketing.
- Holdout group
- A random part of an audience that does not receive a message, used for comparison.
- Baseline
- The expected level of sales or behaviour without the marketing.
- Seasonality
- Regular rises and falls in sales through the year.
- Return on advertising spend
- Sales attributed to advertising divided by its cost.
- Return on investment
- Incremental margin minus cost, divided by cost.
Practice problems
Work each problem on paper first, then reveal the answer to check.
A text campaign reached 1,200 customers, of whom 30 bought; a holdout of 300 had 3 buyers. How many purchases did the campaign cause?
Show answer
The holdout rate is 0.01, so 12 purchases were expected; 30 minus 12 is 18 extra purchases.
Sales last year in a week were 200,000 dollars and the store is growing 5 in 100. What is the expected sales for the week this year?
Show answer
200,000 times 1.05 is 210,000 dollars.
A campaign cost 2,000 dollars and produced 3,000 dollars of incremental margin. What is its return on investment?
Show answer
(3,000 minus 2,000) divided by 2,000 is 0.5.
Why does comparing members with non-members overstate a loyalty program's effect?
Show answer
Customers who already spend more are more likely to join.
Lesson quiz · 5 questions
Score 60% or more to complete this lesson.
Create a free account to save your progress, take quizzes and earn a certificate.