
SLS-257 · Lesson 7 of 12 · 21 min
Customer data and segments
▶ Video coming soon A video version of this lesson is on the way.
On Friday, October 30, 2026, Tessa brought a printout that ran to three pages: every way Juniper & Pine stored information about its customers. The sales system held receipts. The clienteling app on the associates' tablets held profiles, notes and room measurements. The website held online accounts and orders. The email platform held subscribers and what they clicked. The delivery system held addresses and delivery notes, the service inbox held complaints, and since Design Night there was a spreadsheet of project cards. "Seven places," Tessa said, "and they don't agree with each other." She showed one example: a household that appeared as three different customers, with three spellings of the surname, two phone numbers and purchases worth about 9,000 dollars split among them. Aiden recognized it. He had merged those three profiles by hand in September.
This lesson is about customer data: what a store knows about its customers, how to keep it accurate and lawful, and how to group customers into segments so that marketing can treat different customers differently. Segments are the foundation for the personalization in lesson 8, the targeting of email and events, and the measurement in lesson 11.
What a store knows
A store collects three broad kinds of customer data. Identity and contact data says who the customer is and how to reach them: name, address, phone, email and consent records. Transaction data says what they bought, when, where and for how much. Behaviour and preference data covers everything else: website visits and clicks, email responses, event attendance, service requests, notes from conversations, room measurements and stated plans. Transaction data is usually the most reliable, because it is recorded automatically at the point of sale. Preference data is the most useful for good selling and the most fragile, because it depends on people writing it down correctly.
The goal is a single customer view: one record per household that brings together its purchases, contacts and preferences, whichever channel they came through. Few retailers achieve it fully, but every step helps. When the store can see that the customer who bought a mattress in the store last spring also browsed sofas on the website last week and came to Design Night, an associate can have a far better conversation than one who sees only a name.
Keeping the data accurate
Most customer data problems are mundane. Customers give different phone numbers or email addresses at different times. Names are spelled differently. Couples are recorded as two customers or one. Addresses change when people move. Some sales are never linked to anyone. Tessa's review found about 640 likely duplicate profiles among the store's 11,400 customer records, about 6 in 100, and about 2,900 records with no usable email or phone number.
| Problem | Example at Juniper & Pine | Fix |
|---|---|---|
| Duplicates | One household recorded three times with different spellings | Search before creating a profile; merge with care using address and phone |
| Unlinked sales | Cash sales and purchases where no name was given | Ask "Do you have a profile with us?" at every sale; make joining easy |
| Out-of-date contact details | Moved house; changed email | Confirm details at each purchase and delivery |
| Missing consent records | Email addresses with no record of how consent was given | Record the date, method and wording of every consent |
| Notes that cannot be used | Free-text notes such as "nice lady, maybe later" | Use structured fields for rooms, measurements, projects and dates |
| Data nobody needs | Dates of birth collected "just in case" | Collect only what has a clear purpose |
The last row matters as much as the others. Every piece of personal information a store holds is a responsibility: it must be protected, kept accurate, used only for the purposes the customer expected and deleted when it is no longer needed. Collecting less is often the safest choice. Juniper & Pine's clienteling app had a date-of-birth field that associates had been filling in for no reason; Tessa removed it.
The privacy rules
Saskatchewan does not have its own general privacy law for businesses, so Juniper & Pine is governed by the federal Personal Information Protection and Electronic Documents Act (PIPEDA). PIPEDA's principles require a business to identify why it collects personal information, obtain meaningful consent, limit collection and use to what is needed for those purposes, keep information accurate and safeguarded, be open about its practices, and give individuals access to their information. If a breach of security creates a real risk of significant harm, the business must report it to the Office of the Privacy Commissioner, notify the affected individuals and keep a record of every breach for 24 months. A bill to replace PIPEDA, Bill C-36, the Protecting Privacy and Consumer Data Act, was tabled in Parliament on June 15, 2026 and had only had first reading by November 2026, so stores should watch for changes.
Whatever the law in a store's jurisdiction, the practical rules are similar: tell customers plainly what you collect and why, use it the way they would expect, protect it, and do not keep it forever. Juniper & Pine's privacy notice, rewritten that fall, fit on one screen and was printed on the back of the Home Club sign-up form.
Why segment?
A segment is a group of customers who are similar in a way that matters for marketing, so the store can treat them alike. Sending every customer the same message is cheap but wasteful: the household that just bought a sectional does not want a sectional offer, and the household that has bought only candles does not want a dining set invitation. Segmenting lets the store send fewer, more relevant messages and spend more effort on the customers who matter most.
Stores segment customers in several ways. Geographic segments use where customers live, such as the trade area rings in lesson 5. Life-stage segments use events in customers' lives, such as new homeowners, families with young children or people downsizing. Needs-based segments use what customers are trying to do, such as the Design Night households planning a living-room project. And behavioural segments use what customers have actually bought. For a store with good transaction data, behavioural segmentation is usually the most practical place to start.
RFM: recency, frequency and monetary value
The most widely used behavioural method in retail is RFM, which grew out of catalogue and direct-mail marketing. It scores each customer on three measures. Recency is how recently they last bought. Frequency is how often they have bought in a period. Monetary value is how much they have spent. Customers who bought recently, often and a lot are usually the most likely to buy again, and customers whose last purchase was long ago are the most likely to have drifted away. RFM is simple, needs only transaction data and is easy to explain to staff, though it says nothing about why customers buy or what they need next.
Tessa built a simple RFM score for each household that had bought in the past 24 months, using three bands for each measure. Recency scored 3 for a purchase in the last 6 months, 2 for 6 to 12 months and 1 for 12 to 24 months. Frequency scored 3 for three or more purchases in 24 months, 2 for two and 1 for one. Monetary value scored 3 for 4,000 dollars or more, 2 for 1,000 to 3,999 dollars and 1 for under 1,000 dollars.
Worked problem
Scoring a household
On October 30, 2026, Tessa scored a household that bought a dining set for 2,840 dollars in March 2025 and two lamps for 190 dollars in August 2026. What is its RFM score?
Show solution
- Recency: the last purchase, in August 2026, was within the last 6 months, so R = 3.
- Frequency: two purchases in 24 months, so F = 2.
- Monetary value:
- \[2{,}840 + 190 = 3{,}030 \quad (1{,}000 \text{ to } 3{,}999) \Rightarrow M = 2\]
Answer: The household scores 3-2-2: a recent, repeat customer of moderate value. Its history suggests a dining-room household that is now buying smaller items, and a reasonable next step is an invitation to see the spring collection, not a discount.
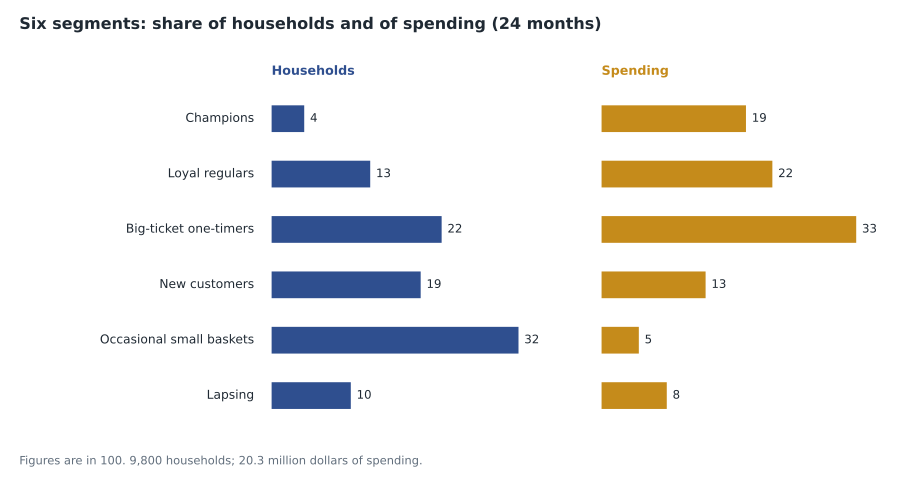
From the scores, Tessa grouped the 9,800 households that had bought in the past 24 months into six practical segments, each with a name staff could remember and a marketing approach.
| Segment | Households | Average spend in 24 months (dollars) | Approach |
|---|---|---|---|
| Champions: recent, frequent, high spending | 410 | 9,200 | Recognize personally; early access; ask for referrals |
| Loyal regulars: two or more purchases, last within 12 months | 1,240 | 3,600 | Keep them informed; invite to events |
| Big-ticket one-timers: one purchase over 2,000 dollars, 6 to 24 months ago | 2,150 | 3,100 | Complete the room: rugs, lighting, décor; care reminders |
| New: first purchase in the last 6 months | 1,880 | 1,450 | Welcome series; check the delivery went well |
| Occasional small baskets: purchases under 500 dollars | 3,120 | 310 | Low-cost email; design advice to grow the relationship |
| Lapsing: last purchase 18 to 24 months ago | 1,000 | 1,700 | One honest win-back message; then let them be |
Worked problem
How concentrated is spending?
Using the segment table, what share of the 9,800 households are Champions or Loyal regulars, and what share of the 24-month spending do they account for?
Show solution
- Households in the two segments:
- \[410 + 1{,}240 = 1{,}650 \qquad 1{,}650 \div 9{,}800 \approx 0.168\]
- Their spending:
- \[410 \times 9{,}200 + 1{,}240 \times 3{,}600 = 3{,}772{,}000 + 4{,}464{,}000 = 8{,}236{,}000\]
- Total spending of all six segments:
- \[3{,}772{,}000 + 4{,}464{,}000 + 6{,}665{,}000 + 2{,}726{,}000 + 967{,}200 + 1{,}700{,}000 = 20{,}294{,}200\]
- Their share of spending:
- \[8{,}236{,}000 \div 20{,}294{,}200 \approx 0.406\]
Answer: About 17 in 100 of households account for about 41 in 100 of linked spending. The pattern, a minority of customers bringing a large share of sales, is common in retail, though it is rarely as extreme as the popular 80-20 rule suggests. It argues for giving these households the best recognition, but not for ignoring the rest: the big-ticket one-timers alone account for a third of spending and are the store's largest opportunity.
Using segments well
Segments are only useful if they change what the store does. Tessa's first test was the big-ticket one-timers. Of the 2,150 households, about 795 had bought a sofa or sectional and nothing for the floor or walls. For them, she planned a short email in November showing rugs and lighting with the sofa models they owned, using the photos from Design Night, and a note for associates to mention the same idea if those customers came in. Lesson 8 follows the result.
Two cautions apply. First, segments describe the past. A household in the "occasional small baskets" group may be about to furnish a new home; the project cards from events and the questions associates ask on the floor catch what transaction data misses. Second, segments must not become a way to treat customers unfairly. Offering the best prices only to the wealthiest households, or excluding neighbourhoods from offers, can damage trust and, if it tracks protected characteristics such as race, religion or disability, can raise human rights and discrimination concerns. Juniper & Pine used segments to choose what to tell customers about, not to decide who deserved fair prices or service.
Keeping segments current
Segments are a snapshot. A new customer becomes a regular; a champion moves away; a lapsing household comes back for a mattress. Tessa planned to rescore every household each month, automatically, so that messages followed the customer's current behaviour rather than last year's. She also planned a short monthly check of the largest movements, such as how many households moved from new to loyal, as an early sign of whether Home Club was working. Segments that no one uses should be dropped; a few clear groups that guide real decisions are worth more than many that only fill a report.
Common mistakes
MistakeCollect every piece of customer information you can; it might be useful.
InsteadCollect only what has a clear purpose; every item must be protected, kept accurate and eventually deleted.
MistakeEach system can keep its own customer list.
InsteadDuplicates and gaps between systems hide who customers are; work toward one record per household.
MistakeRFM tells you what each customer needs.
InsteadRFM summarizes past buying; needs come from conversations, project notes and stated plans.
MistakeFocus all marketing on the top customers.
InsteadTop customers deserve recognition, but large segments such as one-time big-ticket buyers often hold the biggest opportunity.
MistakeSegments can decide who gets the best prices.
InsteadUse segments to choose relevant messages, not to treat groups of customers unfairly.
Summary and key terms
- Customer data includes identity and contact data, transaction data, and behaviour and preference data.
- A single customer view brings each household's purchases, contacts and preferences together across channels.
- Common problems are duplicates, unlinked sales, outdated details, missing consent records, unusable notes and unnecessary data.
- PIPEDA governs Saskatchewan businesses: purpose, consent, limited collection, accuracy, safeguards, openness and access; breaches with a real risk of significant harm must be reported.
- Segments group similar customers; RFM scores recency, frequency and monetary value from transactions.
- At Juniper & Pine, about 17 in 100 of households accounted for about 41 in 100 of linked spending.
- Single customer view
- One record per customer or household combining data from every channel.
- Segment
- A group of customers similar in a way that matters for marketing.
- RFM
- A method that scores customers on recency, frequency and monetary value of purchases.
- Recency
- How recently a customer last bought.
- Data minimization
- Collecting and keeping only the personal information needed for a clear purpose.
- Behavioural segmentation
- Grouping customers by what they have bought or done.
Practice problems
Work each problem on paper first, then reveal the answer to check.
Using Tessa's bands, score a household whose only purchase was a 5,200-dollar sectional 14 months ago.
Show answer
R = 1 (12 to 24 months), F = 1 (one purchase), M = 3 (4,000 dollars or more): 1-1-3.
Why is preference data both the most useful and the most fragile?
Show answer
It shows needs and plans, but depends on staff recording it accurately in usable form.
A store has 800 duplicate profiles among 10,000 records. What share are duplicates?
Show answer
800 divided by 10,000 is 0.08, or 8 in 100.
Give one reason a store should not use segments to decide who gets the best prices.
Show answer
It damages trust and can raise discrimination concerns if it tracks protected characteristics.
Lesson quiz · 5 questions
Score 60% or more to complete this lesson.
Create a free account to save your progress, take quizzes and earn a certificate.