
CRE-330 · Lesson 8 of 12 · 32 min
Budgeting and pricing for profit
Many creators set prices by guessing what the market will bear and set budgets, if at all, by spending whatever is in the account. Both habits make income feel random. This lesson turns the bookkeeping of lesson 7 into forward-looking tools: an annual budget built from realistic revenue estimates, a target-income calculation that tells you how much revenue you need, cost analysis and break-even points, pricing methods that guarantee a profit, simple scenario planning and a monthly review that keeps the plan on track. CRE-310 covered pricing individual brand deals from views and engagement; here the focus is on making sure the whole business makes money.
Start from the income you need
A budget is easiest to build backwards, starting from what you want to take home and working out the revenue needed to produce it. The steps are:
- Decide your target take-home pay for the year, based on your personal budget and savings goals.
- Add the income tax and pension or self-employment contributions you will owe on that income, to get the pre-tax profit needed.
- Add your expected business costs, to get the revenue needed after commissions and fees.
- Gross up for commissions and fees that are calculated as a percentage of revenue.
Worked problem
How much revenue is needed?
A creator wants to take home $60,000. They estimate that tax and contributions will take about 25 % of pre-tax profit at that level. Fixed business costs are $24,000 a year. Variable costs, mainly a 15 % manager commission and 5 % in platform and payment fees, total 20 % of revenue. What revenue is needed?
Show solution
- Pre-tax profit needed: take-home ÷ (1 − tax rate) = $60,000 ÷ 0.75 = $80,000.
- Add fixed costs: $80,000 + $24,000 = $104,000.
- Gross up for variable costs: $104,000 ÷ (1 − 0.20) = $130,000.
- Check: 20 % of $130,000 = $26,000 variable costs; $130,000 − $26,000 − $24,000 = $80,000 profit; 25 % tax leaves $60,000.
Answer: About $130,000 of revenue is needed, more than double the take-home target. Knowing this number turns pricing and pitching from guesswork into a plan.
Estimating revenue realistically
Revenue estimates should be built stream by stream and grounded in evidence: past results, current audience trends, signed contracts and the pipeline of deals in negotiation. For brand deals that are not yet signed, weight each by the probability that it closes.
| Revenue stream | Basis of estimate | Annual estimate |
|---|---|---|
| Signed brand contracts | Contract values | $38,000 |
| Pipeline brand deals | $90,000 of proposals × 40 % average probability | $36,000 |
| Platform revenue | Last 12 months, adjusted −10 % for slower views | $27,000 |
| Affiliate commissions | Last 12 months | $9,000 |
| Memberships | 400 members × $6 × 12 months × 85 % after fees | $24,480 |
| Total | $134,480 |
Be conservative. Platform revenue can fall sharply after algorithm changes; sponsorship budgets shrink in downturns; membership churn erodes recurring revenue. It is better to plan on a cautious figure and be pleasantly surprised than the reverse. Seasonality matters too: many creators earn a large share of sponsorship and ad revenue in the fourth quarter, so a budget should be monthly, not just annual.
Fixed and variable costs
Costs behave differently as revenue changes.
- Fixed costs stay roughly the same regardless of revenue in the short term: software subscriptions, studio rent, a salaried assistant, insurance and accounting fees.
- Variable costs rise and fall with revenue or output: commissions, platform and payment fees, merchandise production and shipping, and per-project freelancers.
The difference matters for decisions. Taking on a fixed cost, such as hiring an editor on a monthly retainer, raises the revenue needed to break even, which increases risk if income falls. Variable costs are safer but often more expensive per unit.
Contribution margin is the share of each revenue dollar left after variable costs, available to cover fixed costs and then profit.
Break-even analysis
The break-even point is the revenue at which profit is zero: all fixed and variable costs are covered but nothing is left over.
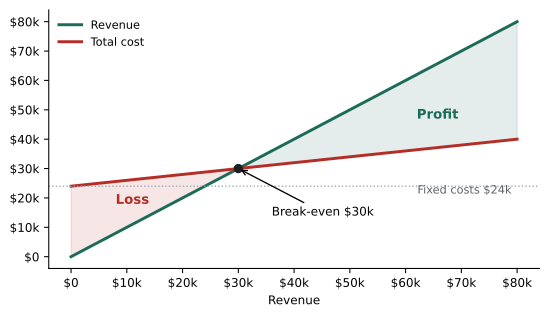
Break-even analysis is especially useful for products. For merchandise, a course or a printed book, it tells you how many units you need to sell before the product makes money.
Worked problem
Break-even for a merchandise drop
A creator plans a hoodie drop. Design, samples and a launch shoot cost $3,600 in fixed costs. Each hoodie sells for $65. Variable costs per hoodie are $24 for production, $9 for fulfillment and shipping subsidy, and payment and platform fees of 6 % of the price. How many hoodies must sell to break even, and what profit results from selling 300?
Show solution
- Fees per unit: 6 % × $65 = $3.90.
- Variable cost per unit: $24 + $9 + $3.90 = $36.90.
- Contribution per unit: $65 − $36.90 = $28.10.
- Break-even units: $3,600 ÷ $28.10 ≈ 128.1, so 129 hoodies.
- Profit at 300 units: 300 × $28.10 − $3,600 = $8,430 − $3,600 = $4,830.
Answer: The drop breaks even at 129 hoodies, and selling 300 earns about $4,830 before tax. If the creator expects to sell only 150, the profit of about $615 may not justify the effort and risk.
Pricing for profit
Market-based pricing tells you what clients may pay; cost-based pricing tells you the minimum you must charge. A profitable business uses both.
For time-based services, such as content production for a brand's own channels, consulting, editing or speaking, calculate a full-cost hourly rate. Not every working hour is billable: time goes to administration, pitching, learning and creating your own content. Utilization is the share of working hours that are billable.
Worked problem
A full-cost hourly rate
A creator offers production services to brands. They want $70,000 of pre-tax profit from this work, and the costs allocated to it are $20,000 a year. They work 46 weeks of 40 hours, and about 55 % of their time is billable. What minimum hourly rate should they charge?
Show solution
- Annual working hours: 46 × 40 = 1,840.
- Billable hours: 1,840 × 0.55 = 1,012.
- Amount to recover: $70,000 + $20,000 = $90,000.
- Rate: $90,000 ÷ 1,012 ≈ $88.93 per hour.
Answer: At least about $89 an hour. Quoting $50 because it "feels fair" would leave the creator well short of their profit goal. Project quotes should be built from estimated hours at this rate, plus a margin for risk and scope creep.
Markup and margin are often confused. Markup is profit as a percentage of cost; margin is profit as a percentage of price. A 50 % markup on a $40 cost gives a $60 price but only a 33 % margin. When a target is stated as a margin, divide cost by (1 − margin).
Allocating revenue as it arrives
Some small business owners use a simple allocation system: every time money arrives, a fixed percentage is moved into separate accounts for tax, the owner's pay, operating expenses and profit or reserves. The idea, popularized as "profit first," is that money you cannot see in your operating account is harder to spend. Percentages depend on the business, but the principle works well for creators with irregular income.
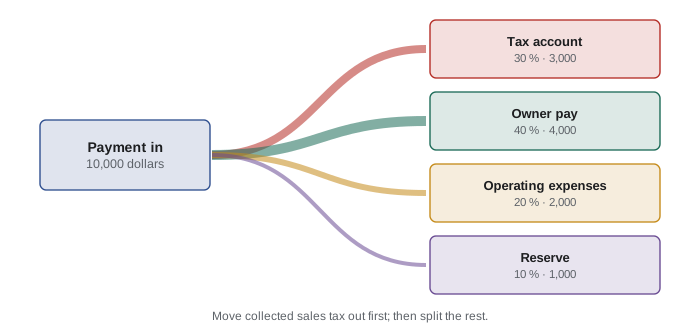
Remember that sales tax collected on product sales is not revenue. Move collected sales tax into the tax account in full before applying the percentages.
Budgeting for growth investments
Growth often requires spending money before it comes back: hiring an editor, buying better equipment, paying for a course or launching a product. Evaluate each investment by its expected return.
Worked problem
Should the creator hire an editor?
An editor would cost $2,500 a month. Hiring them would free 60 hours a month of the creator's time. The creator expects to use 40 of those hours to produce two extra sponsored videos a month at an average fee of $1,800 each, after commission. What is the expected monthly return, and what is the payback if there is a $1,500 one-off cost to train the editor?
Show solution
- Extra revenue: 2 × $1,800 = $3,600 a month.
- Net monthly gain: $3,600 − $2,500 = $1,100.
- Payback of the one-off cost: $1,500 ÷ $1,100 ≈ 1.4 months.
- The remaining 20 freed hours have value too: rest, planning or new projects.
Answer: About $1,100 a month more profit, with the training cost recovered in under two months, provided the extra deals actually materialize. A trial period reduces the risk if demand is uncertain.
Scenario planning
Because creator income is uncertain, a single forecast can mislead. Scenario planning compares a low case, a base case and a high case, and asks what you would do in each.
| Item | Low case | Base case | High case |
|---|---|---|---|
| Revenue | $95,000 | $130,000 | $170,000 |
| Variable costs (20 %) | $19,000 | $26,000 | $34,000 |
| Fixed costs | $24,000 | $24,000 | $24,000 |
| Pre-tax profit | $52,000 | $80,000 | $112,000 |
| Action | Cut a subscription, delay hiring, pitch harder | Proceed with plan | Hire editor, build reserve, invest |
The low case is the most important. If it leaves you unable to cover living costs, you need a larger cash reserve, lower fixed costs or more diversified revenue before committing to new expenses.
Reviewing the budget each month
A budget is only useful if you compare it with reality. Each month, compare actual revenue and costs with the budget, calculate the variance and ask why.
Worked problem
Variance analysis
In September, budgeted revenue was $11,000 and actual revenue $8,600. Budgeted costs were $4,500 and actual costs $5,300. What are the variances, and what might they mean?
Show solution
- Revenue variance: $8,600 − $11,000 = −$2,400 (unfavorable).
- Cost variance: $5,300 − $4,500 = +$800 (unfavorable, because costs rose).
- Profit variance: ($8,600 − $5,300) − ($11,000 − $4,500) = $3,300 − $6,500 = −$3,200.
Answer: Profit was $3,200 below budget. The creator should check whether a deal slipped to October, whether platform revenue fell and what drove the extra costs, then adjust the forecast and the pitching plan.
Over time, the budget becomes more accurate and the creator develops a feel for the business's rhythm: which months are strong, which costs creep up and which revenue streams are reliable.
Packages and retainers
Recurring arrangements make budgets far more predictable than one-off deals. A retainer is a fixed monthly fee for an agreed bundle of work, such as two videos and four stories a month for a brand or a set number of consulting hours. Price a retainer from the same full-cost and market calculations as single deals, then offer a modest discount in exchange for the commitment, usually of three to twelve months. Define what happens to unused deliverables, how extra work is billed and how either side can end the arrangement. Even one or two retainers can cover a large share of fixed costs, which lowers the risk of every other decision in the budget.
A useful test before signing any recurring deal is to calculate the share of fixed costs it covers. A $2,500 monthly retainer covers all of a $2,000 monthly fixed-cost base, so every other deal that month contributes straight to profit.
Common mistakes
MistakeSetting prices by gut feel or by copying other creators.
InsteadCalculate the revenue you need and a full-cost minimum rate.
MistakeCounting every pitch as income in the budget.
InsteadWeight pipeline deals by their probability of closing.
MistakeAdding fixed costs during a good month.
InsteadCheck the break-even point and the low-case scenario first.
MistakeConfusing markup and margin.
InsteadPrice for a target margin by dividing cost by (1 − margin).
MistakeMaking a budget in January and never looking at it again.
InsteadReview variances monthly and update the forecast.
Summary and key terms
- Build the budget backwards from target take-home pay to the revenue needed.
- Estimate revenue stream by stream and weight unsigned deals by probability.
- Fixed costs raise break-even revenue; variable costs scale with revenue.
- Break-even revenue = fixed costs ÷ contribution margin ratio.
- A full-cost hourly rate accounts for profit, costs and non-billable time.
- Allocating each payment to tax, pay, expenses and reserves smooths irregular income.
- Plan low, base and high scenarios and review variances monthly.
- Budget
- A plan of expected revenue and costs for a period.
- Fixed cost
- A cost that does not change with revenue in the short term.
- Variable cost
- A cost that changes with revenue or output.
- Contribution margin
- Revenue minus variable costs.
- Break-even point
- The revenue or sales at which profit is zero.
- Utilization
- The share of working hours that are billable.
- Markup
- Profit as a percentage of cost.
- Margin
- Profit as a percentage of price.
- Scenario planning
- Comparing outcomes under low, base and high assumptions.
- Variance
- The difference between actual and budgeted figures.
Practice problems
Work each problem on paper first, then reveal the answer to check.
Take-home $50,000 with 20 % tax: pre-tax profit needed?
Show answer
$62,500.
Fixed costs $18,000, contribution margin ratio 75 %. Break-even revenue?
Show answer
$24,000.
Price $40, variable cost $22, fixed costs $2,700. Break-even units?
Show answer
150.
Cost $30, target margin 40 %. Price?
Show answer
$50.
A 50 % markup on $40 gives what margin?
Show answer
$20 ÷ $60 ≈ 33 %.
1,600 hours at 50 % utilization, $75,000 to recover. Hourly rate?
Show answer
$93.75.
Pipeline of $60,000 at 35 % probability. Weighted value?
Show answer
$21,000.
Actual costs $3,900, budget $4,200. Variance?
Show answer
−$300 (favorable).
A $6,000 payment split 30/40/20/10. Tax account amount?
Show answer
$1,800.
Why is the low scenario the most important?
Show answer
It shows whether the business can survive a bad year.
Lesson quiz · 5 questions
Score 60% or more to complete this lesson.
Create a free account to save your progress, take quizzes and earn a certificate.